Bullish view
-
Buy the BTC/USD pair and set a take-profit at 67,500.
-
Add a stop-loss at 60,000.
-
Timeline: 1-2 days.
Bearish view
-
Sell the BTC/USD pair and set a take-profit at 60,000.
-
Add a stop-loss at 67,500.
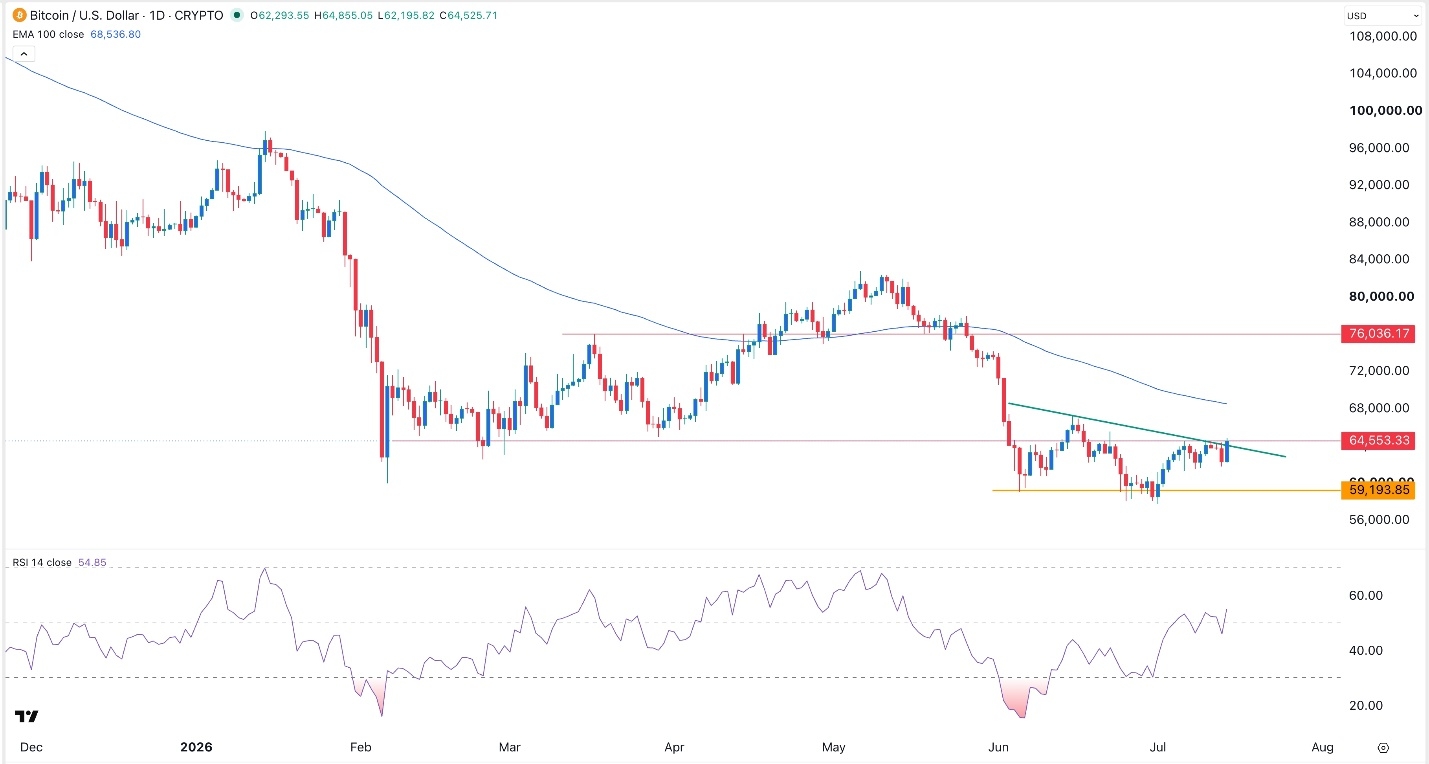
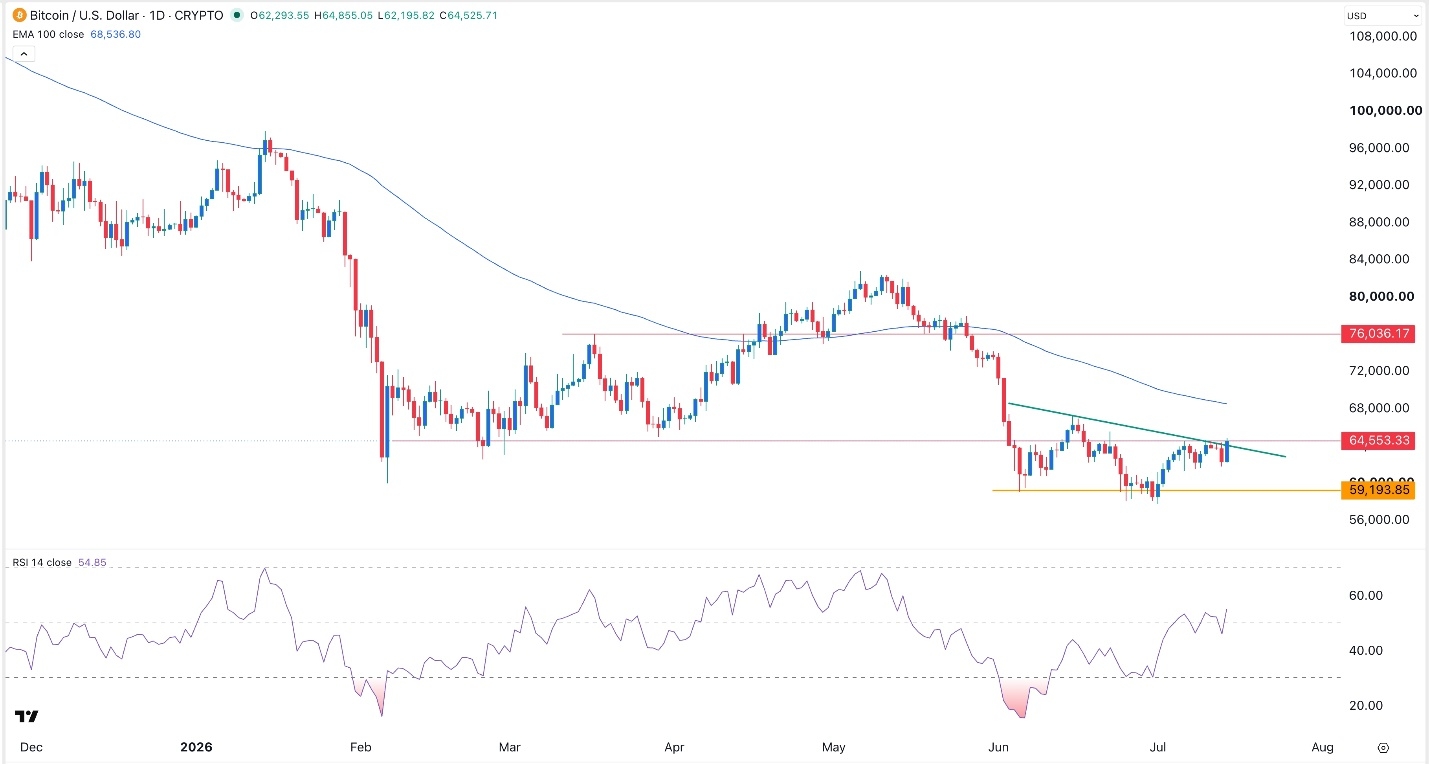
Bitcoin price continued rising, reaching its highest level since June 22nd as traders embraced a risk-on sentiment following the release of the encouraging consumer inflation data. The BTC/USD pair rose to 64,500, up substantially from the year-to-date low of 57,900.
US Inflation Reduces Odds of Interest Rate Hikes
The BTC/USD pair jumped as traders reacted to the latest US consumer inflation report. Data showed that the headline consumer price index (CPI) dropped by 0.4% in June, missing the estimated slowdown of 0.4%. Inflation eased from 4.2% in May to 3.5% in June, also lower than the expected 3.8%.
The report was highly bullish because it came over a week after the US published a weak non-farm payrolls (NFP) report. This report revealed that the economy added just 57k jobs in June, missing the estimated 114k. As a result, there is a possibility that the Federal Reserve will not hike interest rates this month.
Still, Bitcoin faces several Fed-related challenges. For example, the US-Iran war has resumed, raising the possibility that inflation will start ticking up in the near term. Crude oil prices have continued rising this week, with Brent rising to $85 and the WTI moving to $83. As a result, market participants still expect the Fed to hike rates later this year.
Bitcoin is also at risk as ETF outflows. Data shows that these funds have shed over $400 million in assets this month, erasing the gains they made last week.
The next key catalyst that may move Bitcoin later today will be the upcoming US producer price index (PPI) report. Also, Kevin Warsh, the Federal Reserve Chairman, will deliver his statement to the Senate Banking Committee.
BTC/USD Technical Analysis
Technicals suggest that the BTC/USD pair may continue rising in the near term. It has formed an inverted head-and-shoulders-like pattern, a common bullish reversal sign in technical analysis. It has also moved above the 25-day moving average.
Oscillators are also pointing to renewed momentum. The two lines of the Percentage Price Oscillator (PPO) have formed a bullish crossover and are moving upwards. The Relative Strength Index (RSI) has jumped above the neutral point of 50.
Therefore, the coin will likely continue rising as bulls target the key resistance at 67,375, its highest point on June 15. A move above that level will point to further downside, potentially to 70,000.
Ready to trade our free daily Forex trading signals? We’ve shortlisted the best MT4 crypto brokers in the industry for you.
Crispus Nyaga is a Technical Analyst at DailyForex with more than eight years of experience as a financial analyst, coach, and trader. He specializes in technical analysis of major currency pairs and cryptocurrencies, using chart patterns, trend structure, and key indicators to frame trading scenarios for Forex and digital asset markets. Crispus has worked with well-known brokers including ATFX, easyMarkets, and OctaFX, and his market commentary has been published widely on platforms such as Seeking Alpha, InvestingCube, Capital.com, and Invezz.
As seen on: SeekingAlpha, Macrostreet.com, Invezz.com, Forbes, Investing.com, Marketwatch, Crypto.news