Bearish view
-
Sell the BTC/USD pair and set a take-profit at 60,000.
-
Add a stop-loss at 68,000.
-
Timeline: 1-2 days.
Bullish view
-
Buy the BTC/USD pair and set a take-profit at 68,000.
-
Add a stop-loss at 60,000.
The BTC/USD pair retreated slightly after the Federal Reserve delivered a hawkish interest rate decision and as demand for cryptocurrencies waned. Bitcoin price retreated to $64,330 from this week’s high of $67,114. It has slipped by over 22% from its highest point in May this year.
Bitcoin Price Retreats After Hawkish Fed
Bitcoin and other risky assets like stocks retreated, while US bond yields rose after Kevin Warsh and his team delivered the first interest rate decision of the year. In it, officials decided to leave them unchanged between 3.50% and 3.75%.
The bank remained concerned about the state of the US inflation, with eight members voting for a rate hike. Analysts now expect that the bank will hike rates by 0.25% in the October meeting if inflation remains at an elevated level.
Bitcoin and other risky assets tend to retreat when the Fed is in a tightening phase. The coin also retreated as the recent rebound lost momentum amid falling demand from American investors.
Data shows that spot Bitcoin ETFs have continued shedding assets this week. They have now lost over $2 billion this month after losing another $2 billion in the previous month. In total, they have shed over $3 billion this year, with analysts rotating from cryptocurrencies to the stock market.
Investors are turning to stocks, which have continued thriving this year, with the top indices like the Dow Jones, Kospi, and Nikkei 225 rising to their all-time highs amid the ongoing artificial intelligence boom.
BTC/USD Technical Analysis
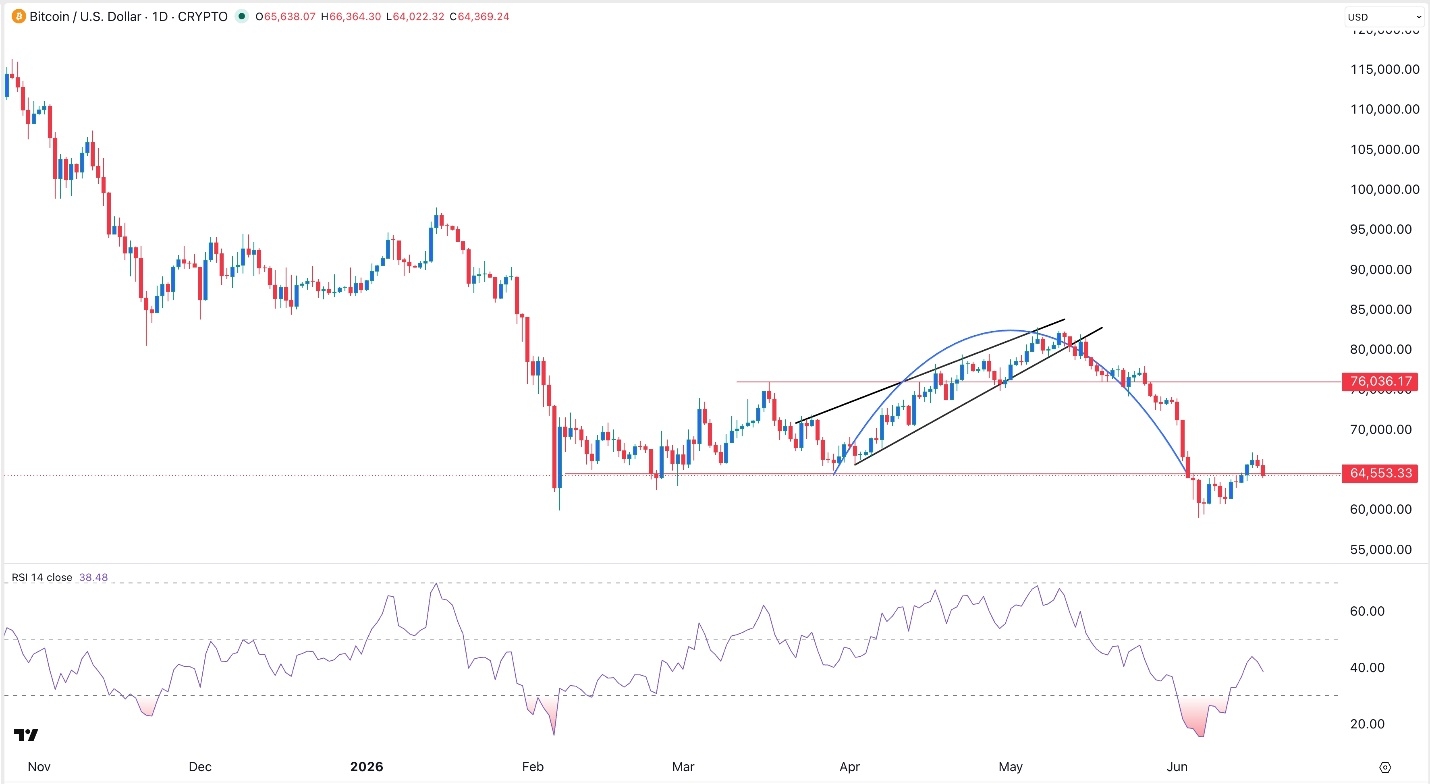
The daily chart shows that the BTC/USD pair has retreated in the past two days, moving from a high of 67,115 on Tuesday to the current 64,153. A closer look shows that the pair has formed an inverted cup and shoulders pattern, a common bearish continuation sign in technical analysis.
The pair is in the process of forming the handle section of this pattern. Also, it has slipped below the 50-day and 100-day Exponential Moving Averages (EMA).
Therefore, the most likely scenario is where it continues falling, with the initial target being the year-to-date low of 59,000. This view will become invalidated if it moves above the key resistance level at 67,115.
Ready to trade our daily Forex signals? Here’s a list of some of the best crypto brokers to check out.
Crispus Nyaga is a Technical Analyst at DailyForex with more than eight years of experience as a financial analyst, coach, and trader. He specializes in technical analysis of major currency pairs and cryptocurrencies, using chart patterns, trend structure, and key indicators to frame trading scenarios for Forex and digital asset markets. Crispus has worked with well-known brokers including ATFX, easyMarkets, and OctaFX, and his market commentary has been published widely on platforms such as Seeking Alpha, InvestingCube, Capital.com, and Invezz.
As seen on: SeekingAlpha, Macrostreet.com, Invezz.com, Forbes, Investing.com, Marketwatch, Crypto.news