Key Highlights
- USD/JPY remained supported above the 158.00 pivot level.
- A bullish trend line is forming with support at 158.50 on the 4-hour chart.
- Bitcoin trimmed gains and traded below the $67,500 support.
- WTI Crude Oil prices again rallied and broke the $105 resistance.
USD/JPY Technical Analysis
The US Dollar formed a base above 158.20 against the Japanese Yen. USD/JPY started a fresh increase above 158.80 and 159.20.
Looking at the 4-hour chart, the pair cleared the 50% Fib retracement level of the downward move from the 160.46 swing high to the 158.27 low. The pair is now well above the 100 simple moving average (red, 4-hour) and the 200 simple moving average (green, 4-hour).
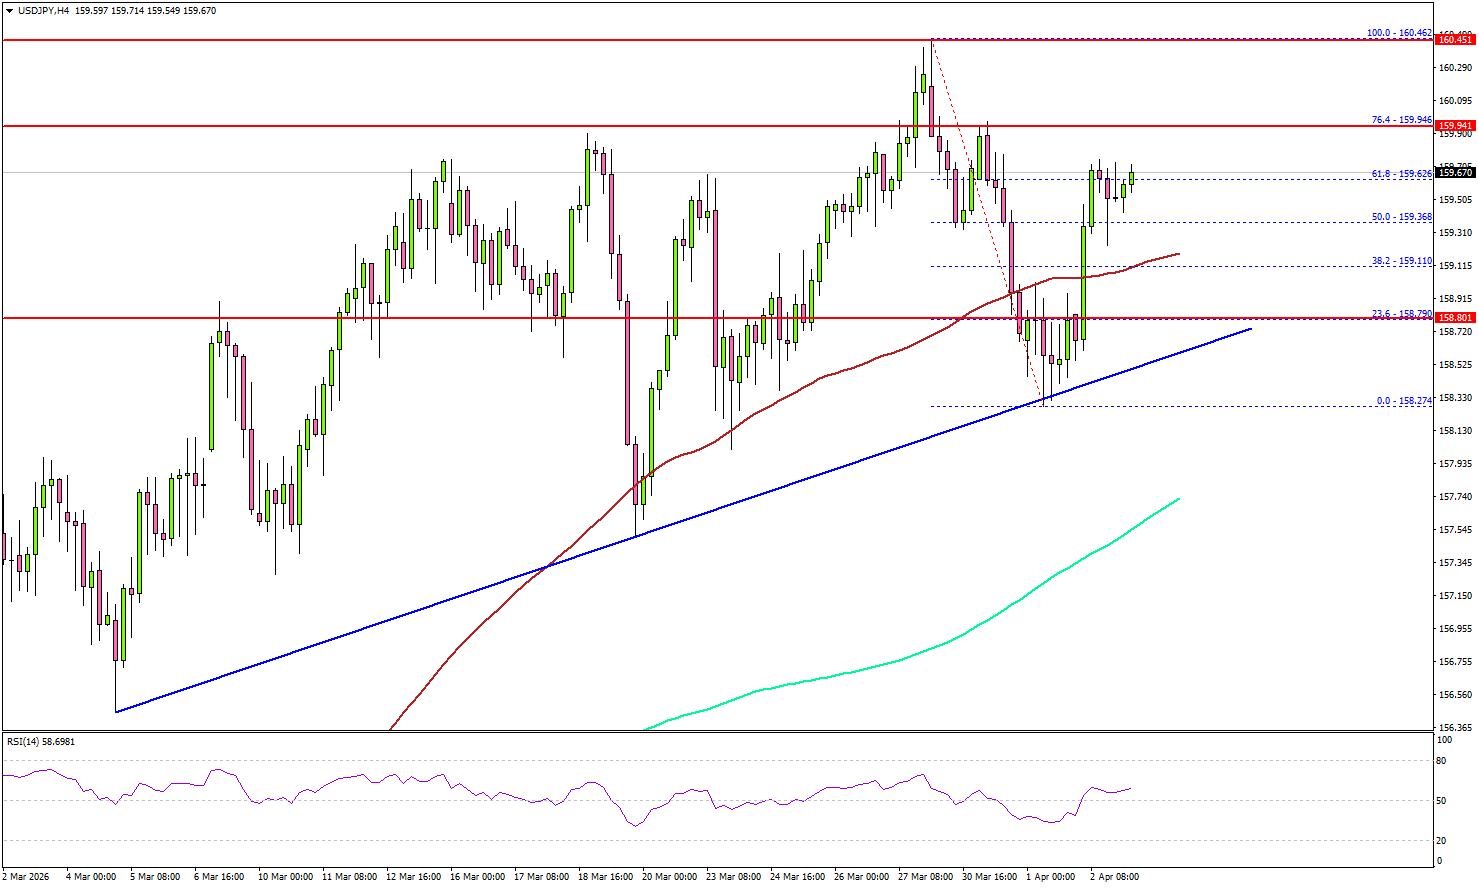
On the upside, the pair could face resistance near the 76.4% Fib retracement level of the downward move from the 160.46 swing high to the 158.27 low at 159.95.
The first major resistance sits at 160.20. The main resistance could be 160.50. A close above 160.50 could open the doors for gains above 161.20. In the stated case, the bulls could aim for a move to 162.00.
Immediate support is seen near 159.10. The first key support sits at 158.50. There is also a bullish trend line forming with support at 158.50. A close below 158.50 might call for heavy losses. In the stated case, it could even revisit 157.50 and the 200 simple moving average (green, 4-hour).
Looking at Oil, the price started a fresh surge, and the bulls were able to pump the price above the $105 barrier.
Upcoming Key Economic Events:
- US nonfarm payrolls for March 2026 – Forecast 60K, versus -92K previous.
- US Unemployment Rate for March 2026 – Forecast 4.4%, versus 4.4% previous.