For most of the time since the pandemic, large-cap stocks have outperformed their smaller counterparts in the US stock market. That is, the LargeCap S&P 500 index has outperformed the MidCap S&P 400 and SmallCap S&P 600, collectively the “SMidCaps.” That started to change late last year as investors increasingly concluded that the former’s earnings outlook had become riskier and its valuations stretched. The SMidCaps’ earnings, which had been flat since late 2022, began moving higher late last year, with valuations that were relatively low. Thus began the Great Valuation Rotation of the Roaring 2020s.
Early last year, global investors also began rotating away from the US toward other markets. They did so because the US had outperformed the rest of the world since 2010, raising its market-capitalization share of the MSCI to a record 65% last year. So it was time to rebalance into stock markets with lower valuation multiples. This global rebalancing is likely to continue this year.
The rebalancing of domestic and global stock portfolios has been increasingly driven by concerns about the sustainability of the Magnificent-7’s rapid earnings growth, as the hyperscalers among them have made major commitments to dramatically increase spending on AI infrastructure. Those concerns have weighed on the Mag-7’s valuation multiples, while lifting the valuations of stocks in other areas of the US stock market and overseas stock markets in general.
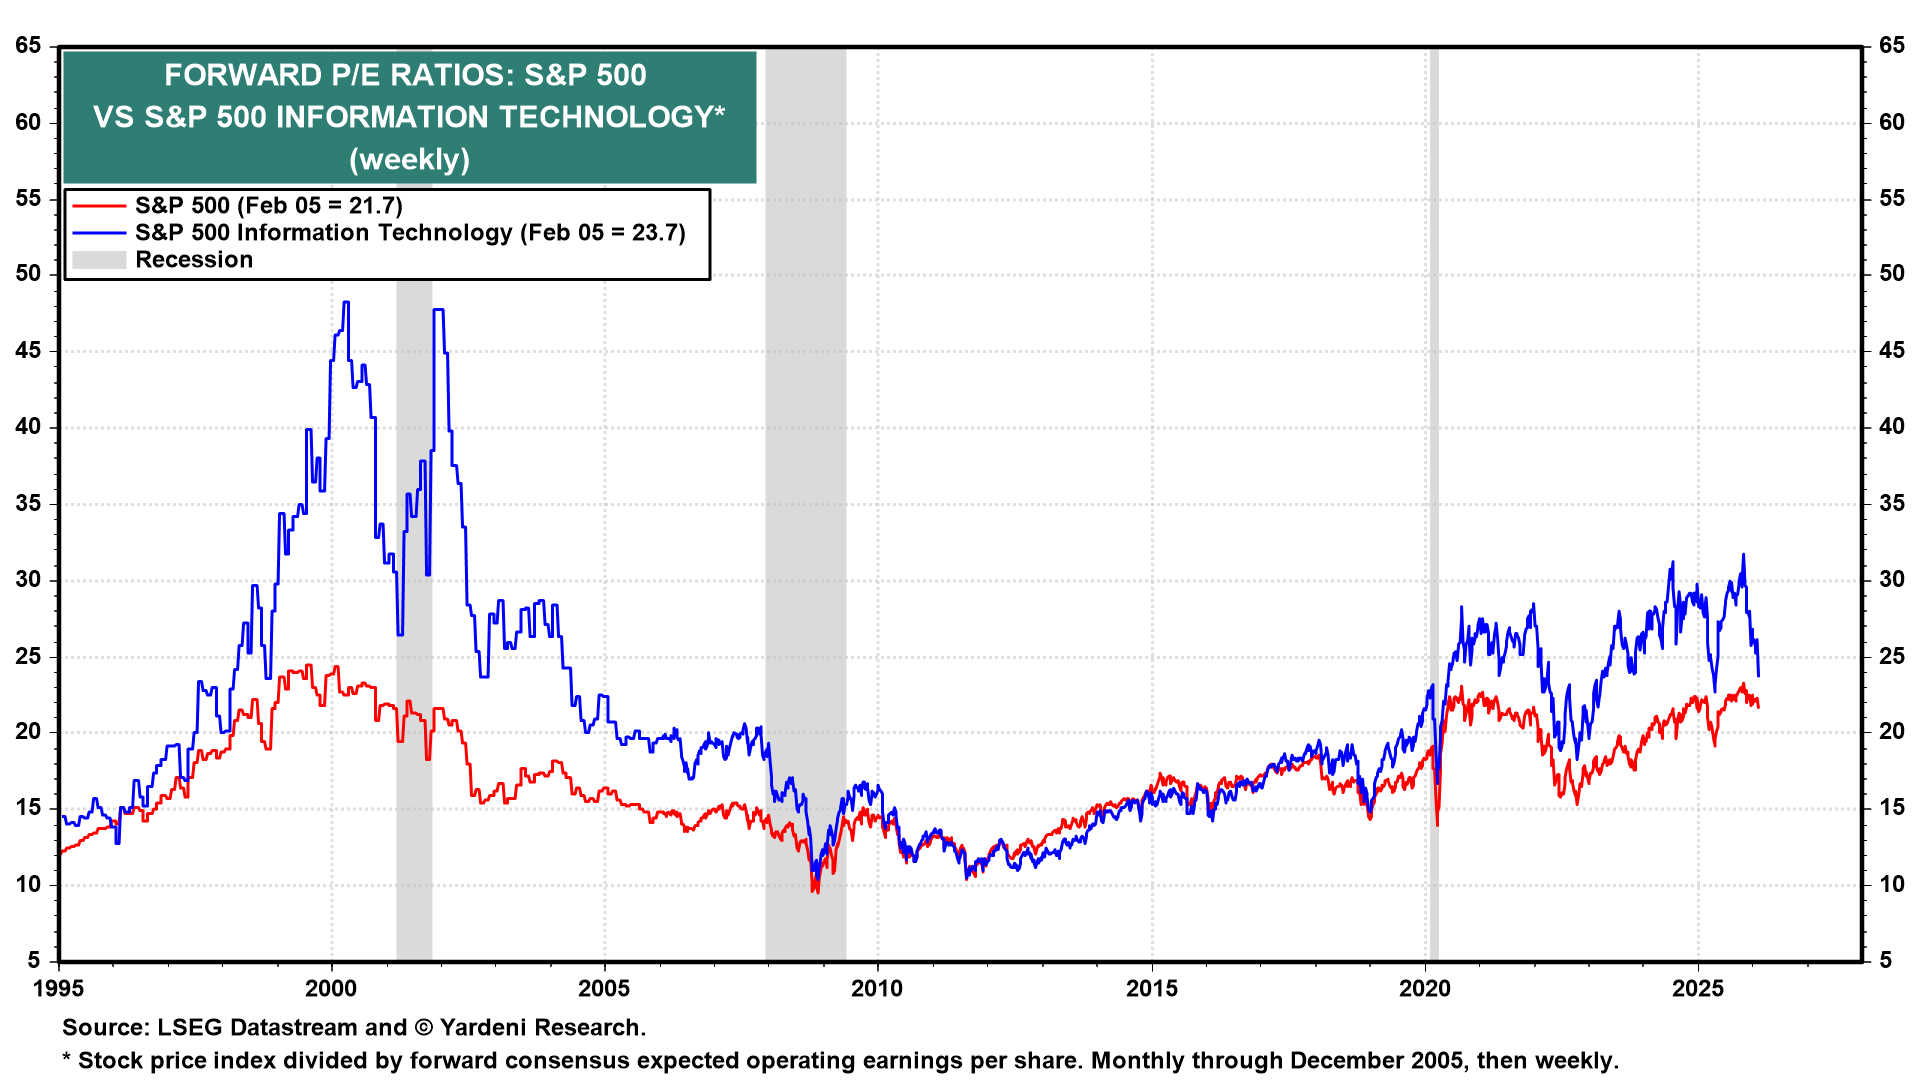
At the start of the year, we assigned a 20% subjective probability to a meltup/meltdown scenario. That’s relatively low. We are even more comfortable with it now that the likelihood of an AI-related stock market bubble is much less likely. The S&P 500 Information Technology sector’s forward P/E is back down to 23.7 from over 30.0 late last year (chart). A repeat of the 1999/2000 Tech Wreck is clearly much less likely than widely feared last year.
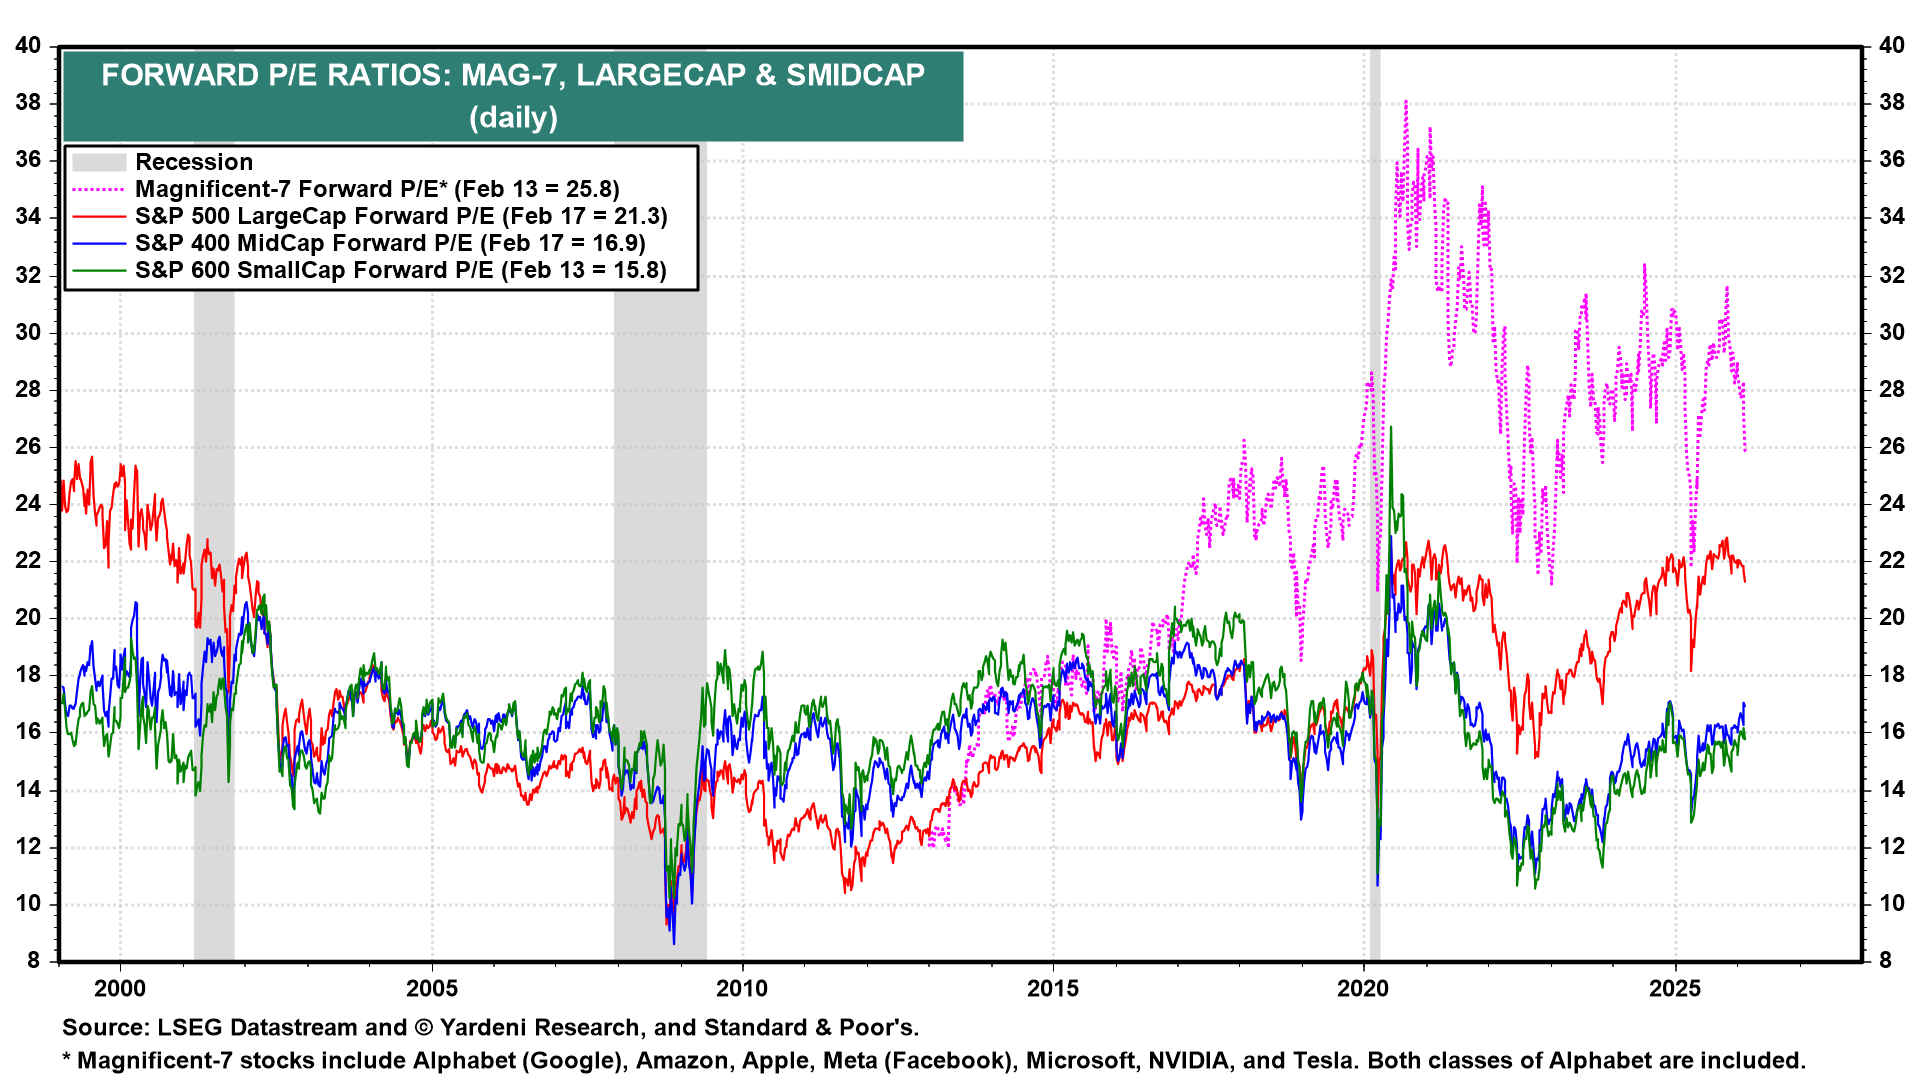
The forward P/E of the Magnificent-7 has dropped from almost 32.0 a year ago to 25.8 currently (chart). This has weighed on the forward P/E of the S&P 500, while the forward P/Es of the SMidCaps have edged higher over the past year.
Excluding the Magnificent-7, the forward P/E of the S&P 500’s Impressive-493 has been remarkably stable around 20.0 for the past year (chart). Their outperformance so far this year has been attributable to their record-setting earnings performance.

