
The Wall Street Journal reported that the stock market’s valuation is higher today than during the dot-com bubble of the late 1990s and early 2000s. That sounds scary to investors, but perhaps valuations deserve to be higher.
The Journal used price-to-sales (P/S) as the metric to assert that “U.S. stocks are now pricier than they were in the dot-com era.” The Journal cited that the S&P 500 index recently traded at 3.23 times sales of its component companies, more than its peak of 2.87 in 2000. There are many ways to measure valuation, and P/S is a legitimate methodology. However, given that today’s companies are materially different from those from a quarter century ago, it is also misleading.
A more widely regarded valuation metric is the price-to-earnings ratio (P/E). The P/E ratio in 1999 approached a dizzyingly high 33. (P/E ratios can be measured in various ways, so if you see different numbers elsewhere, it is due to methodology. So long as it is applied consistently and smoothed for anomalies, any method is acceptable.)
Today’s forward 12-month P/E ratio for the S&P 500 is 22.1 (based on the level of the index as of the time of this writing; as the price level changes, so will the ratio).
The current P/E of 22.1 is substantially less than the P/E of 33 achieved in 1999, but it is still extremely high, at least relative to history. Today’s P/E ratio is higher than the five-, 10-, and 25-year averages of 19.9, 18.5, and 16.8, respectively. And today’s P/E of 22.1 is higher than the average P/E since 1988 of 19.6 (which includes the bubble prices of the 1990s).
The P/E ratio reached a low of 16.2 during the COVID crash of 2020. At the bottom of the 2022 market decline, the P/E ratio hit 16.8; that low point matched the average P/E of the last quarter century. Let’s reflect on that: During two great times to buy stocks, the lows of 2020 and 2022, the P/E ratios were not eye-poppingly low—they were merely in line with long-term averages. Does that seem right? Intuitively, doesn’t it seem that valuations should be lower after the market crashes?
(Fun fact for nerds: P/E ratios are frequently higher at the bottom of a market’s downturn because stock prices fall more than earnings. Thus, counterintuitively, P/E ratios can increase when stock prices fall. The bottom of a market’s downturn is often characterized by a re-rating, where those valuations become cheaper in anticipation of a recovery in earnings, making stocks more attractive. To be clear, those P/Es I cited at the 2020 and 2022 lows—16.2 and 16.8—reflected the re-rating, so the distortions were squeezed out.)
Some old-school investors, like me, may anchor their memories to buying stocks when they were defined as “cheap” when the P/E ratio hit low double digits (P/Es hit 12 after Black Monday in 1987, 13 after the 1990 recession, and 14 following the Great Recession). So, why aren’t valuations hitting those rock-bottom levels anymore? The fact is, a lot has changed over the years, and significantly more over the decades. Companies are worth more today than they used to be.
The businesses that make up today’s market are very different from those that filled the indices of the 1990s. When you look at how companies have changed, how they earn money, manage risk, and serve customers, it becomes clear that higher valuations reflect the reality of stronger, more resilient businesses.
I am no Pollyanna—”Capital Ideas” has routinely cited high stock market valuations as a concern—but it is not as bad as the headlines suggest. That being said, I was a professional investor up to and through the dot-com bubble, the commodity bubble of 2008, and the meme stock craze of 2021. I understand that during bubbles, investors will tell themselves what they must to rationalize their delusions.
People will buy any security (or quasi-security) just because its price is rising. “Investors” don’t need any other reason than that, whether it is driven by greed or fear of missing out. Once they make the purchase, they will tell themselves and each other what feels like a rational story to support it. In 1999, people came up with new valuation metrics to ignore little things like profitability (he said, sarcastically). Price-to-clicks and price-to-potential are examples of creative metrics that were used; who needed earnings when you had website visitors?!
The point is, I am aware that people delude themselves to gloss over serious concerns and that self-awareness guides me to objectively list the reasons why stocks today should be worth more than their 1999 counterparts.
Predictability through recurring revenue
Companies are better today at making sales by giving the customer what they want, which is repeatedly high value without repeated invoicing.
Think about how companies used to make money. A manufacturer had to line up new contracts each quarter. A retailer had to hope customers showed up every season. There was always the risk that sales could disappear.
Now consider the subscription models we see everywhere today. From software to streaming services to cloud computing, businesses have shifted toward recurring revenue. That means cash flow is far more predictable. Investors reward that predictability with higher valuations because steady earnings are less risky than volatile ones. I discuss their hierarchy of revenue and how it affects valuation in this video.
Bigger markets, bigger opportunities
Modern companies enjoy larger addressable markets. Today’s global population is 8.2 billion people, a 36 percent increase from 6 billion in 1999.
There are 48,669 public companies today, a 26 percent increase from the 38,414 in 1999. Including non-public companies, the growth rate of all businesses was similar (from 250 million to 358 million).
Global Gross Domestic Product (GDP) is $111.3 trillion today, 140 percent more than the GDP amount in 1999.
Additionally, a consumer brand decades ago might have sold only within U.S. borders due to the high costs of exporting. Today, the same brand can reach customers worldwide, thanks to global logistics and digital platforms.
Technology companies are remarkably scalable in ways that were not possible in the past. Apple, for example, has evolved past selling devices; now it runs a global ecosystem of apps and services. When the customer base increases, the growth potential is much greater, and valuations adjust accordingly.
Productivity and efficiency
Corporate productivity has leapt forward as well. Automation, artificial intelligence (AI), collaboration tools, cloud systems, and data analytics help companies produce more with fewer resources.
The U.S. Bureau of Labor Statistics measures productivity data, like GDP per hour worked. From 1999 to 2025, the U.S. workforce has become approximately 35 percent more productive; each 2025 employee adds more value to the company than their 1999 counterpart.
Companies are generating more profit from every dollar of labor investment. That efficiency makes companies more valuable than similar firms of past decades.
Better managed businesses
Today’s executives and boards have far more sophisticated tools to measure performance, manage risk, and stay accountable to shareholders.
In 1999, firms mostly ran local servers. Today, businesses rent computing power, storage, and software instead of investing heavily in on-premises infrastructure. Nowadays, there is e-commerce, automation, AI, data-driven decision-making, widespread use of enterprise resource planning for logistics, remote work, cross-functional teams, an emphasis on employee retention, alternative financing, digital marketing, customer relationship management software, and scalable demand.
Additionally, transparency has increased, and governance standards are higher. That means companies are less likely to stumble because of poor oversight or opaque decision-making. Stronger management reduces risk, and lower risk translates into higher valuations.
The cost of capital
Over the last couple of decades, access to alternative capital such as venture equity, private credit, sovereign wealth funds, and SPACs (special purpose acquisition companies) has made it easier for businesses to gain access to the lifeblood of doing business: cash. And that cash can be used toward operations and investment, as opposed to burdening the company with debt when buying plant, property, and equipment (listed as long-term capital on the balance sheet).
Today, the market is dominated by technology and technology-supported companies, with fewer asset needs and lighter capital requirements. These “asset-light” companies don’t need to build factories to match customer growth; they can grow by leveraging intellectual property, software, and networks. That structure naturally commands higher valuations, especially given that today’s companies are using that capital more efficiently. For instance, let’s compare five of the biggest companies in 1999 to those of today.
In 1999, five of the most significant companies were Intel, Cisco, IBM, Oracle, and Microsoft. Today, five of the largest companies include Nvidia, Apple, Meta, Alphabet, and Microsoft, which is still in the mix.
According to DataTrek, the average operating margins of 2025’s big five are 40 percent better than their 1999 cohorts (39.9 percent versus 28.4 percent). Net margins are 65 percent better (34.2 versus 20.9). Return on equity is 2.3 times better (66.5 percent versus 28.1 percent). And the average revenue and net income of today’s big five are 4.6 and 9.1 times higher, respectively, than the inflation-adjusted results of the big five of 1999.
More broadly, profit margins for the aggregate companies of the S&P 500 index have been increasing over the decades. The margins for those companies were 5.6 percent in the 1990s, 6.3 percent in the 2000s, and 8.8 percent in the 2010s. Profit margins have averaged 10.3 percent in the 2020s and are currently 11.3 percent.
As Datatrek astutely pointed out in the assessment of their calculations, whether investors are willing to pay a given multiple is a separate consideration. However, these fundamental comparisons support the argument that today’s companies should enjoy a valuation premium over those of the late 1990s.
None of this means investors should throw caution to the wind. High valuations still matter, and they can affect returns. But when we compare today’s market to a historical snapshot, it is helpful to recognize the differences. Today’s companies are less capital-intensive and more profitable than the companies of yesterday. They are more global, more efficient, more predictable, and more skillfully managed.
The intention is not to tell a bullish story; rather, my purpose is to dispel the notion that valuation comparisons to the dot-com bubble are relevant or helpful. Nonetheless, despite stock prices being high, there is a non-zero chance of a late-1990s-like melt-up in stocks. There are similarities.
In 1994, as in 2022, a Federal Reserve interest rate shock occurred after a period of low rates. There was optimism about a disruptive new technology in the 1990s, namely the internet. And today, the rapid advancement of artificial intelligence is changing the way we work.
On December 5, 1995, then-Fed Chair Alan Greenspan infamously described the stock market as irrationally exuberant, not unlike The Journal’s description of the stock market now. Following Greenspan’s comments, the use of the internet and email became more widespread and took the path to ubiquity.
By 1995, the Internet’s commercial potential was realized with the launch of companies like Netscape, Amazon, and eBay. By 1997, webmail tools like Yahoo Mail allowed 10 million people worldwide to use email. By 1998, the number of people using email had grown to 66 million, and by 1999, it had reached 150 million.
During the last few years, AI adoption has skyrocketed in both the business and consumer sectors, primarily driven by the explosion of easy-to-use generative AI tools. The adoption rate of generative AI has surpassed that of the internet and personal computers at similar stages of their development.
In November 2022, ChatGPT gained widespread popularity almost immediately after its release, reaching 1 million users in just five days. Now, less than three years later, it has nearly 800 million users.
There is no doubt that the stock market is not cheap. If the AI trade does play out and sparks another stock market bubble, I still expect several significant pullbacks that make investors question the future of the stock market.
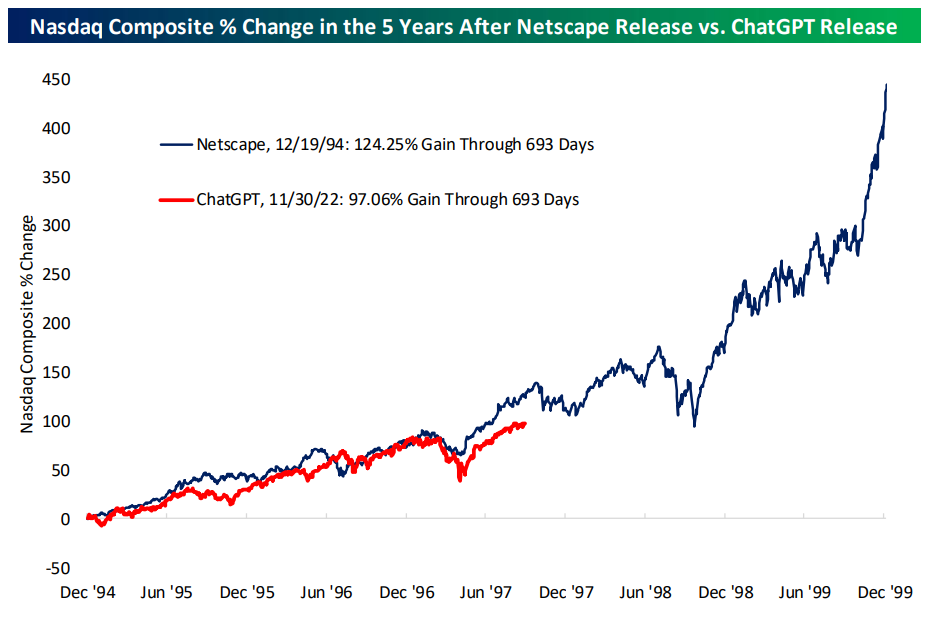
According to Bespoke’s chart below, the Nasdaq’s performance following the release of the Netscape web browser, a technology that symbolized the start of the dot-com boom, is similar to its performance since the release of ChatGPT in October 2022, which kicked off the AI boom, through September 5, 2025.
While the trajectory for stock market returns in the 1990s is anything but linear, it is supportive of my belief that there is a non-zero chance that an AI bubble is forming. Forming, but not there yet. So long as the U.S. economy stays out of a recession, I plan on remaining invested. The economy is a lot weaker than some people think, so I will keep an eye on things for you and let you know if it is time to put the brakes on.
Allen Harris is an owner of Berkshire Money Management in Great Barrington and Dalton, managing more than $1 billion of investments. Unless specifically identified as original research or data gathering, some or all of the data cited is attributable to third-party sources. Unless stated otherwise, any mention of specific securities or investments is for illustrative purposes only. Advisor’s clients may or may not hold the securities discussed in their portfolios. Advisor makes no representation that any of the securities discussed have been or will be profitable. Full disclosures here. Direct inquiries to Allen at AHarris@BerkshireMM.com.

