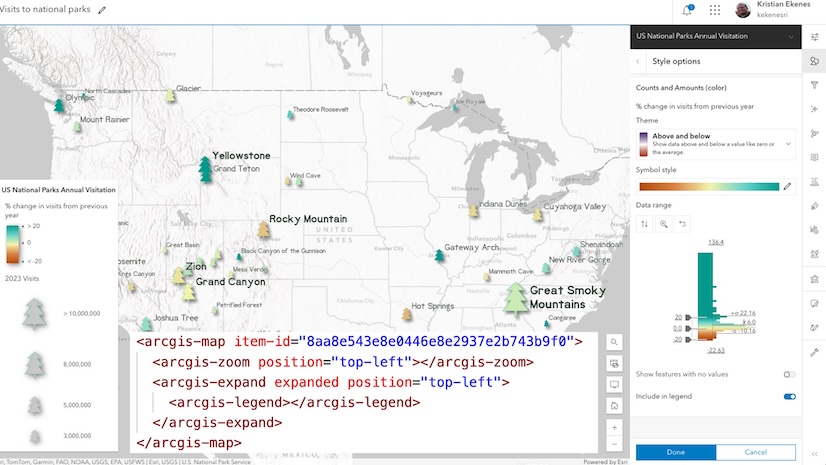
In Good, better, best—Simplify your web app development with Map Viewer I demonstrate the benefits of using Map Viewer as a starting point for creating web apps in ArcGIS. I recommend you first read that article as it sets a foundation for this one. In this article, I’ll demonstrate how to create a custom web app, based on a web map configured in Map Viewer, that adds functionality not available in Map Viewer or other configurable ArcGIS apps.
In the previous article, I configured this web map, which shows the number of people who visited U.S. national parks in 2023.
I loaded all the data and configurations stored in this web map to a custom application built with the ArcGIS Maps SDK for JavaScript (JS Maps SDK). We’ll use the web map and this basic application as the foundation for building a more dynamic application in this article.
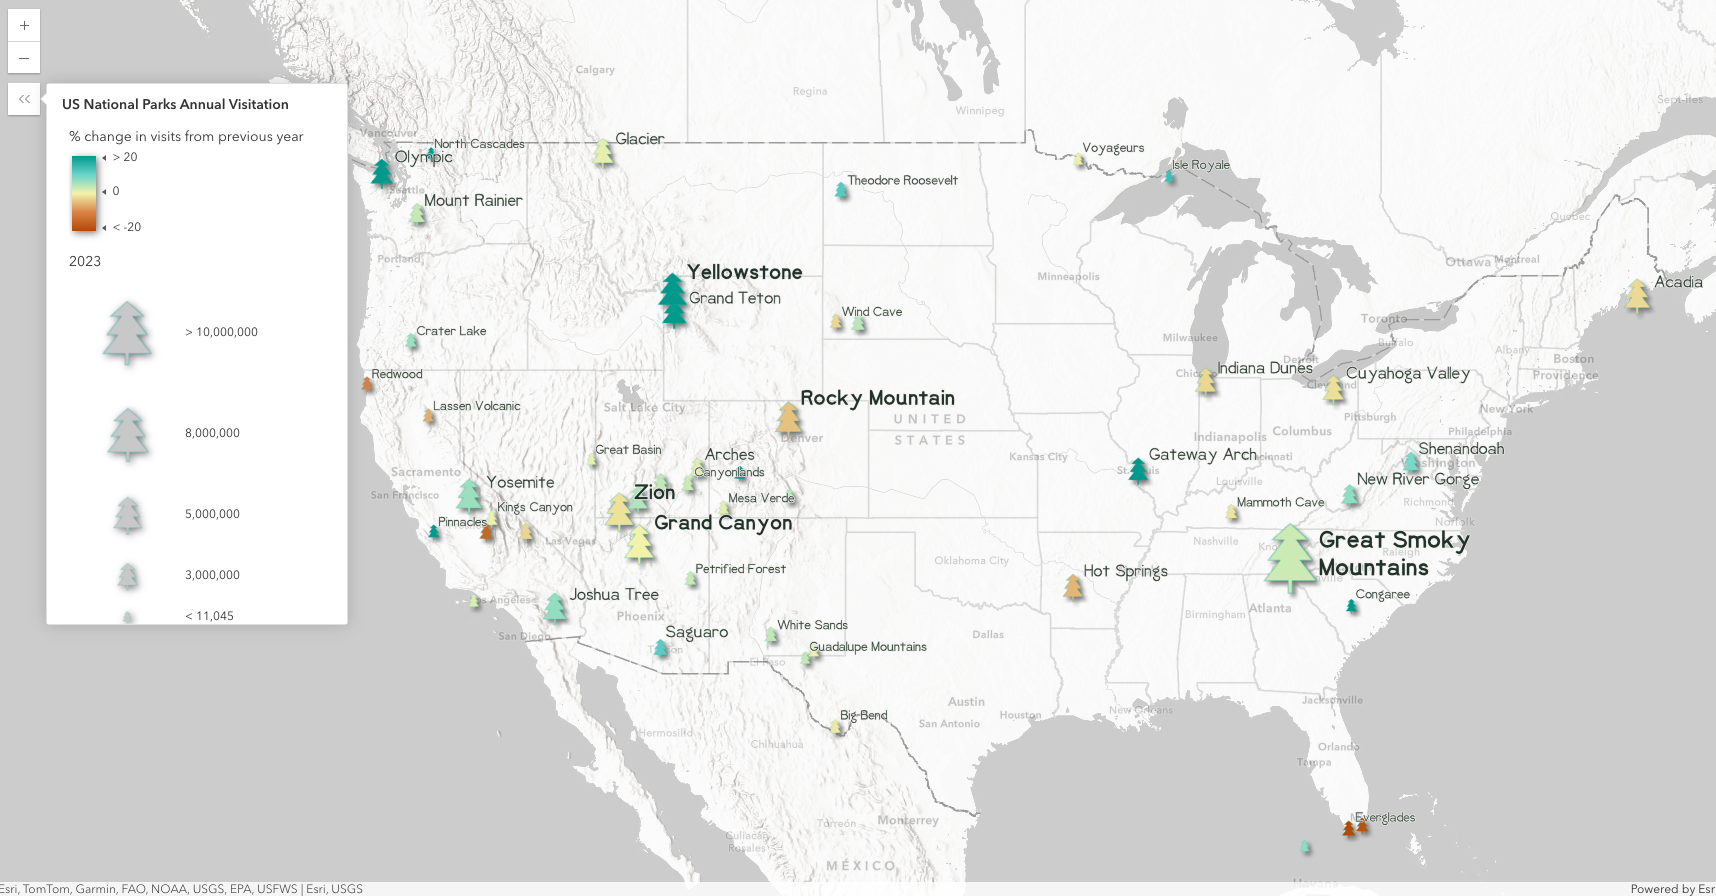
Remember, loading the web map in a custom app built with the JS Maps SDK saves me about 700 lines of code from the start.
Go beyond the web map with the JS Maps SDK
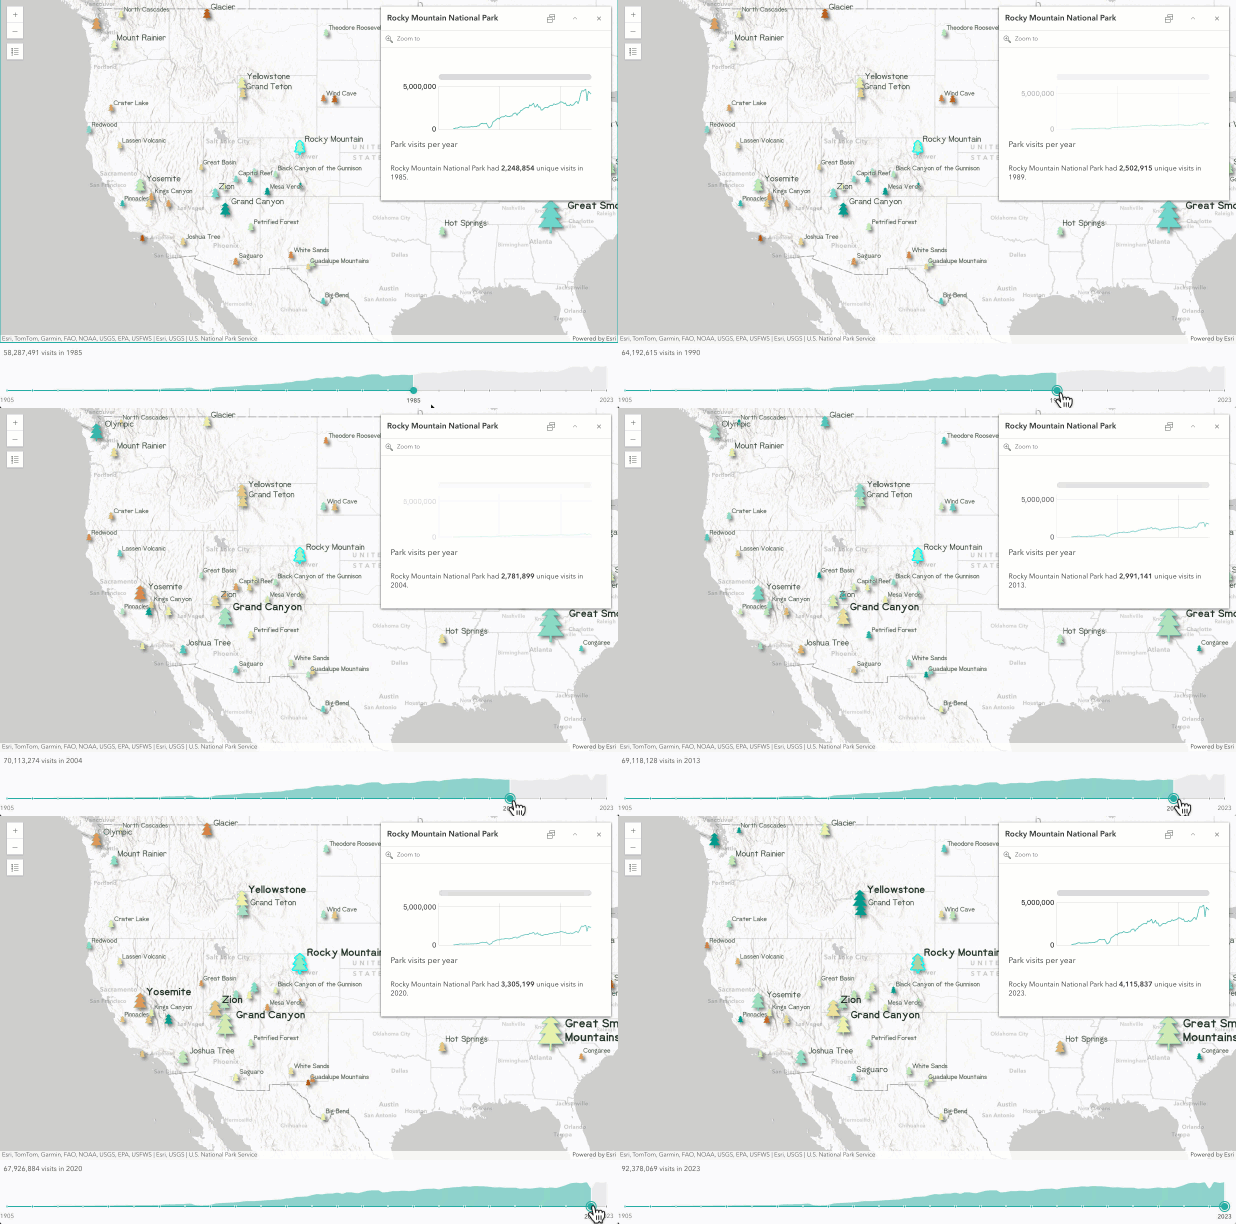
Let’s take this app a step further and add data exploration capabilities not currently available in Map Viewer. I would like the user to explore the data from 1905 to 2023 using a slider, not just 2023 data. Since Map Viewer, and none of Esri’s configurable apps, allow me to do this, I’ll use the JS Maps SDK to build a custom application to accomplish this goal. The JS Maps SDK gives developers full control over building innovative and interactive user experiences.
I’ll add calcite components to help with the layout, including a slider at the bottom of the app. This will allow the user to explore data from multiple years. Note the arcgis-map component that references the item ID of the initial web map.
<calcite-shell>
  <arcgis-map item-id="8aa8e543e8e0446e8e2937e2b743b9f0">
    <arcgis-zoom position="top-left">arcgis-zoom>
    <arcgis-expand expanded position="top-left">
      <arcgis-legend>arcgis-legend>
    arcgis-expand>
  arcgis-map>
  <calcite-shell-panel id="slider-panel" slot="panel-bottom" layout="horizontal">
    <div id="slider-container">
      <label>
        <span id="slider-label">Year: 2023span>
        <calcite-slider
          has-histogram id="yearSlider" label-handles label-ticks
          ticks="5" min="1905" max="2023" value="2023" step="1"
          min-label="1905" max-label="2023" scale="m"
        >calcite-slider>
      label>
    div>
  calcite-shell-panel>
calcite-shell>
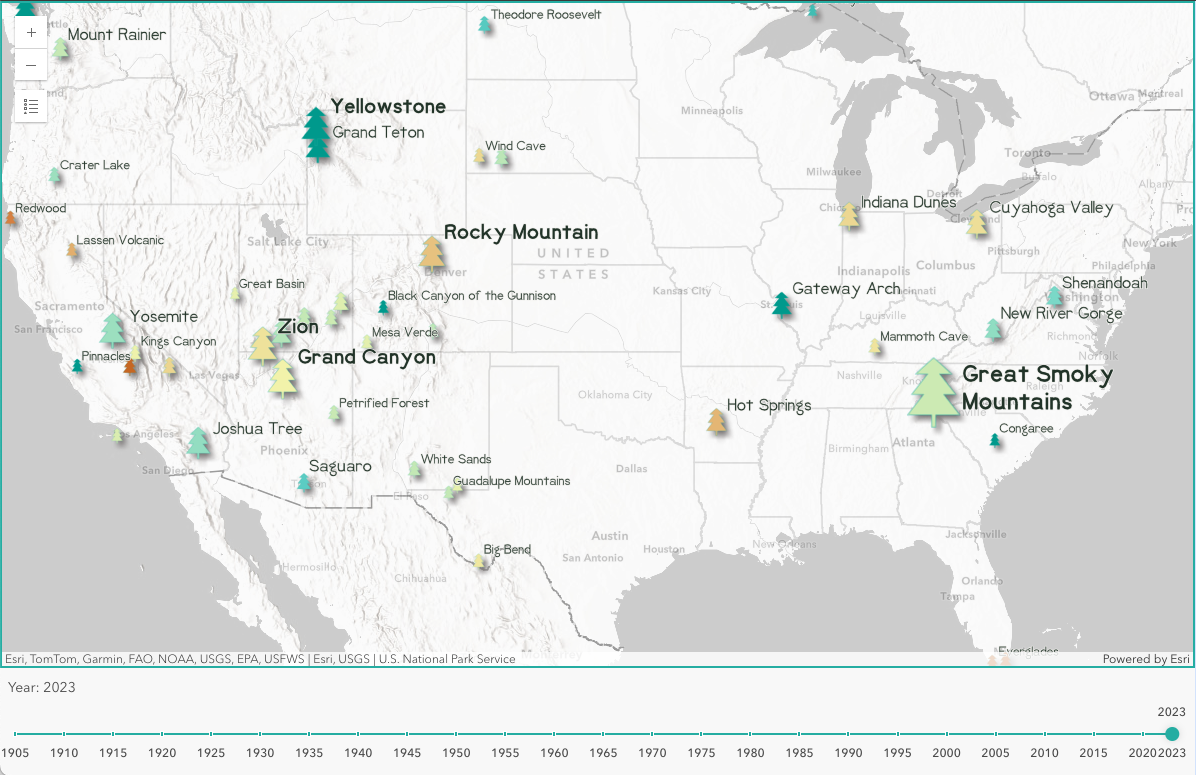
At this point, I haven’t been required to write any JavaScript. However, since I want to add custom behavior to the slider, I now need to define this using JavaScript.
<body>
  <calcite-shell>

  calcite-shell>

  <script>
    ...// JS code goes here to control behavior of slider...
  script>
body>

html>
There are two events I need to define behavior for: when the map loads and when the user slides the slider handles.
Event 1: When the map loads
The Calcite slider includes an option for adding a histogram. I want to set the histogram to represent the total number of visits to all parks for each year corresponding to the slider stops.
When the map loads, the app queries statistics for all national park visits for each year. I then push these numbers to the Calcite Slider’s histogram property, which renders nicely on top of the slider.

The code for querying this data is below.
require([
  "esri/intl"
], (esriIntl) => {
  const yearSlider = document.querySelector("calcite-slider");
  const arcgisMap = document.querySelector("arcgis-map");
  const sliderLabel = document.getElementById("slider-label");

  arcgisMap.addEventListener("arcgisViewReadyChange", async () => {

    const layer = arcgisMap.map.layers.at(0);

    const stats = await queryTotalVisits({ layer });
    const histogram = createHistogram(stats);
    yearSlider.histogram = histogram;

    const visits2023 = esriIntl.formatNumber(stats[`F${2023}`]);
    sliderLabel.innerText = `${visits2023} visits in ${2023}`;

  // Returns an object containing total visits
  // for each year 1905-2023
  // {
  //   F2020: 67926884
  //   F2021: 92243362
  //   F2022: 88660294
  // }
  async function queryTotalVisits({ layer }) {
    const query = layer.createQuery();
    query.outStatistics = [];

    const startYear = 1905;
    const endYear = 2023;

    for (let year = startYear; year <= endYear; year++) {
      query.outStatistics.push({
        onStatisticField: `F${year}`,
        outStatisticFieldName: `F${year}`,
        statisticType: "sum"
      });
    }

    const { features } = await layer.queryFeatures(query);
    const stats = features[0].attributes;
    return stats;
  }

  // transform histogram result into the format required
  // by the CalciteSlider component, for example...
  // [
  //   ...
  //   [2020, 67926884],
  //   [2021, 92243362],
  //   ...
  // ]
  function createHistogram(stats) {
    const histogram = [];
    for (const stat in stats) {
      const year = parseInt(stat.replace("F", ""));
      histogram.push([year, stats[stat]]);
    }
    return histogram;
  }
});
Event 2: When the user interacts with the slider
Each time the user interacts with the slider, the app needs to update the layer’s renderer, labels, and popup template to represent data for the indicated year. Note this is not a filter capability. This is an update to various layer configurations originally saved in Map Viewer based on a single slider interaction.
// Each time the slider handle is moved, update the data
// displayed in the layer's renderer, labels, popup, and slider
yearSlider.addEventListener("calciteSliderInput", () => {
  const year = yearSlider.value;

  const renderer = updateRenderer({ layer, year });
  layer.renderer = renderer;

  const labelingInfo = updateLabels({ layer, year });
  layer.labelingInfo = labelingInfo;

  const popupTemplate = updatePopupTemplate({ layer, year });
  layer.popupTemplate = popupTemplate;

  const visits = esriIntl.formatNumber(stats[`F${year}`]);
  sliderLabel.innerText = `${visits} visits in ${year}`;
});
Let’s explore the functions that update each of the following configurations when the slider’s value changes.
- Renderer
- Labels
- Popup Template
Renderer
The map author originally configured the renderer in Map Viewer using the smart mapping panel. The renderer has two data-driven visual variables:
- Size – represents the total visits for a year. In this case, the size variable points to a specific field to return this data.
- Color – represents the percent change in visits from the previous year. In this case, the color variable references an Arcade expression that calculates this value.
The app needs to update the fields and expressions referenced by both visual variables based on the slider’s position. When we make apps that compare values between different years, it’s important to compare on the same scale and data ranges. For that reason we don’t need to be concerned with the stops or break points set by the map author in Map Viewer. All the developer should be concerned with is that the data matches the year represented by the slider position.
function updateRenderer({ layer, year }) {
  const renderer = layer.renderer.clone();
  renderer.valueExpression = createArcadeExpression({ year });

  const colorVariable = renderer.visualVariables.find(({ type }) => type === "color");
  colorVariable.valueExpression = createArcadeExpression({ year });

  const sizeVariable = renderer.visualVariables.find(({ type }) => type === "size");
  sizeVariable.field = `F${year}`;
  sizeVariable.legendOptions = {
    title: `Visits in ${year}`
  };

  return renderer;
}

function createArcadeExpression({ year }) {
  const current = year;
  const previous = year - 1;

  const expression = `var s = $feature.F${previous};
    var e = $feature.F${current};
    return ((e - s) / s) * 100;`;

  return expression;
}
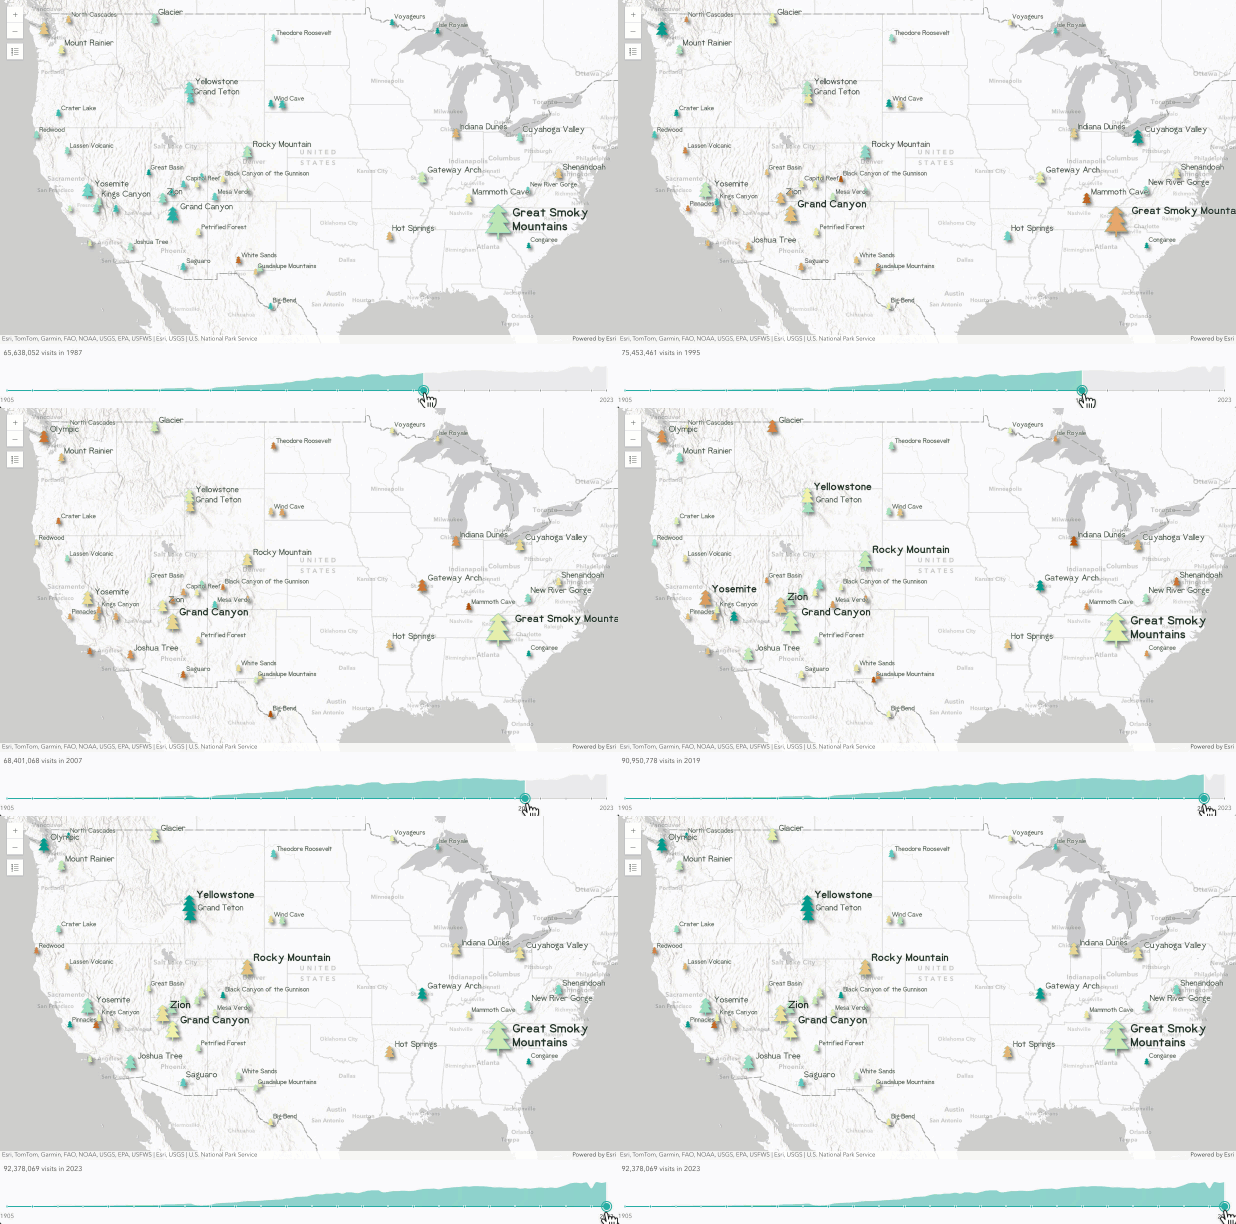
Once the updated renderer is reset on the layer, the view updates with the appropriate symbols. Note how fast and performant these updates take place…up to 60 frames per second!
Labels
Labels are sized dynamically based on the visits to each park. To accomplish this, I configured four label classes with various font sizes in Map Viewer. The font size directly corresponds to number of visitors. This is controlled by the where clause of each label class. We simply need to update these where clauses to replace the invalid field name with the field corresponding to the new slider value.
function updateLabels({ layer, year }) {
  const labelingInfo = layer.labelingInfo;
  labelingInfo.forEach((labelClass) => {
    labelClass.where = labelClass.where.replace(/[F][0-9]{4}/gm, `F${year}`);
  });
  return labelingInfo;
}
You can see the labels properly update in the previous graphic.
Popup Template
I configured the popup template in Map Viewer to display a line chart showing the total number of visits to the selected park from 1905-2023. This content element does not need to be updated as the data remains constant. However, the text element below the chart should update to correspond to the slider value.
The function below gets the popup templates text element and updates the referenced field based on the slider position.
function updatePopupTemplate({ layer, year }) {
const popupTemplate = layer.popupTemplate.clone();
const textElement = popupTemplate.content.find((element) => {
return element.type === "text";
});
textElement.text = `{Park} had {F${year}} unique visits in ${year}.
`;
return popupTemplate;
}
Conclusion
Now the app is complete! Check out the final app here. Because I started with Map Viewer and saved the various layer configurations as a web map, I significantly reduced the amount of code I needed to write (only 179 lines).
When building an app with the JS Maps SDK, I always suggest striving to write as few lines of code as possible. Creating web maps in Map Viewer saves you a lot of time and makes the map configuration process more enjoyable than punching random numbers in JSON or JavaScript.
Always start with a web map. If you need a little more functionality, then the JS Maps SDK gives you all the APIs and components you need to be successful. In this way, Map Viewer and the JS Maps SDK make a strong foundation upon which you can build powerful and innovative mapping applications.
