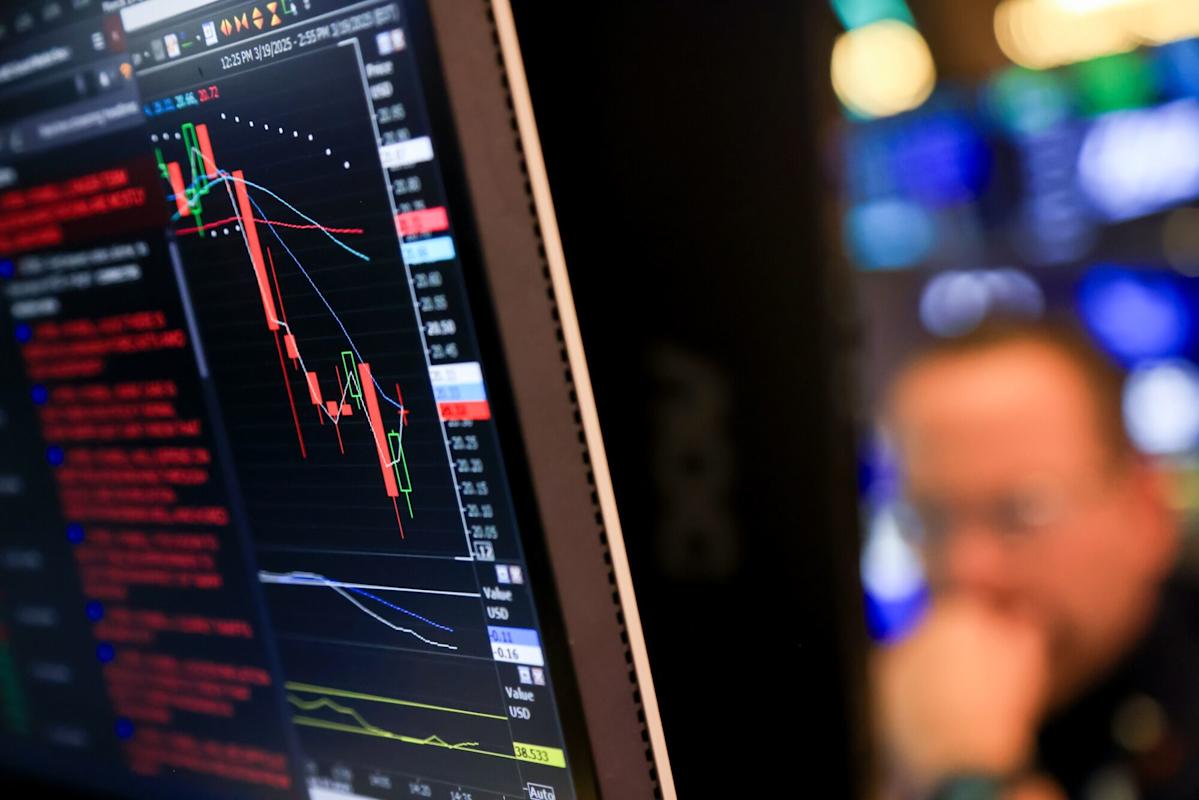
Stock market traders have their eyes glued to some key technical charts to get a sense of where the market is headed next as the equities rout becomes increasingly intense over fears of trade uncertainty and slowing economic growth.
The S&P 500 Index (^SPX) briefly sank below the first ominous milestone traders were watching at the start of the session — 5,504.65, the most recent intraday low touched on March 13. But the broad equities benchmark quickly reclaimed that level and was down 1.2% to around 5,516 at 10:26 a.m. in New York on Monday. The question now is whether it stays there.
“That was the low that kick-started the 5% rally, showing there were buyers there,” said JC O’Hara, chief market technician at Roth Capital Partners. “Plenty of eyes will be watching to see if the bulls can defend that line again.”
Traders are looking for anything that can give them a clue of the market’s behavior ahead of the crucial April 2 deadline when President Donald Trump’s administration is expected to announce “reciprocal tariffs” on all countries. At the same time, several Wall Street strategists on Monday sounded the alarm on US equities, citing risks to growth from the lack of clarity on trade policy.
“When the fundamental picture is as hazy as it currently is — be it economic growth, geopolitics or earnings — technicals provide a clearer view of behavior,” said Mark Hackett, chief market strategist at Nationwide. “Technicals are a temperature check, measuring the psychology of investors, their patterns of behavior, and the supply-demand for shares.”
From a technical perspective, if the S&P 500 closes beneath its March 13 low, there isn’t much support “until 5,400,” O’Hara said. That’s a 3.2% drop from Friday’s close.
Technical strategists also recommend keeping an eye on market breadth, looking for more evidence of washed-out conditions. A 10% or less reading in the percentage of stocks trading above their 20-day moving average would be “a good sign of a capitulation,” said Adam Turnquist, chief technical strategist at LPL Financial.
The stock market’s fear gauge — the CBOE Volatility Index, or the VIX — is under close scrutiny as well. It’s currently hovering near 24, a level that indicates traders are getting anxious. And market pros are watching to see if it approaches 30, which would indicate rising distress. Before the stock market bottoms, the VIX needs to re-test the high of 29.57 touched earlier this month, Jeff Jacobson, derivatives strategist at 22V Research, wrote in a note to clients on Sunday that the VIX would need to at least re-test the the highs touched earlier this month before markets can bottom.


