Screening and selection processes
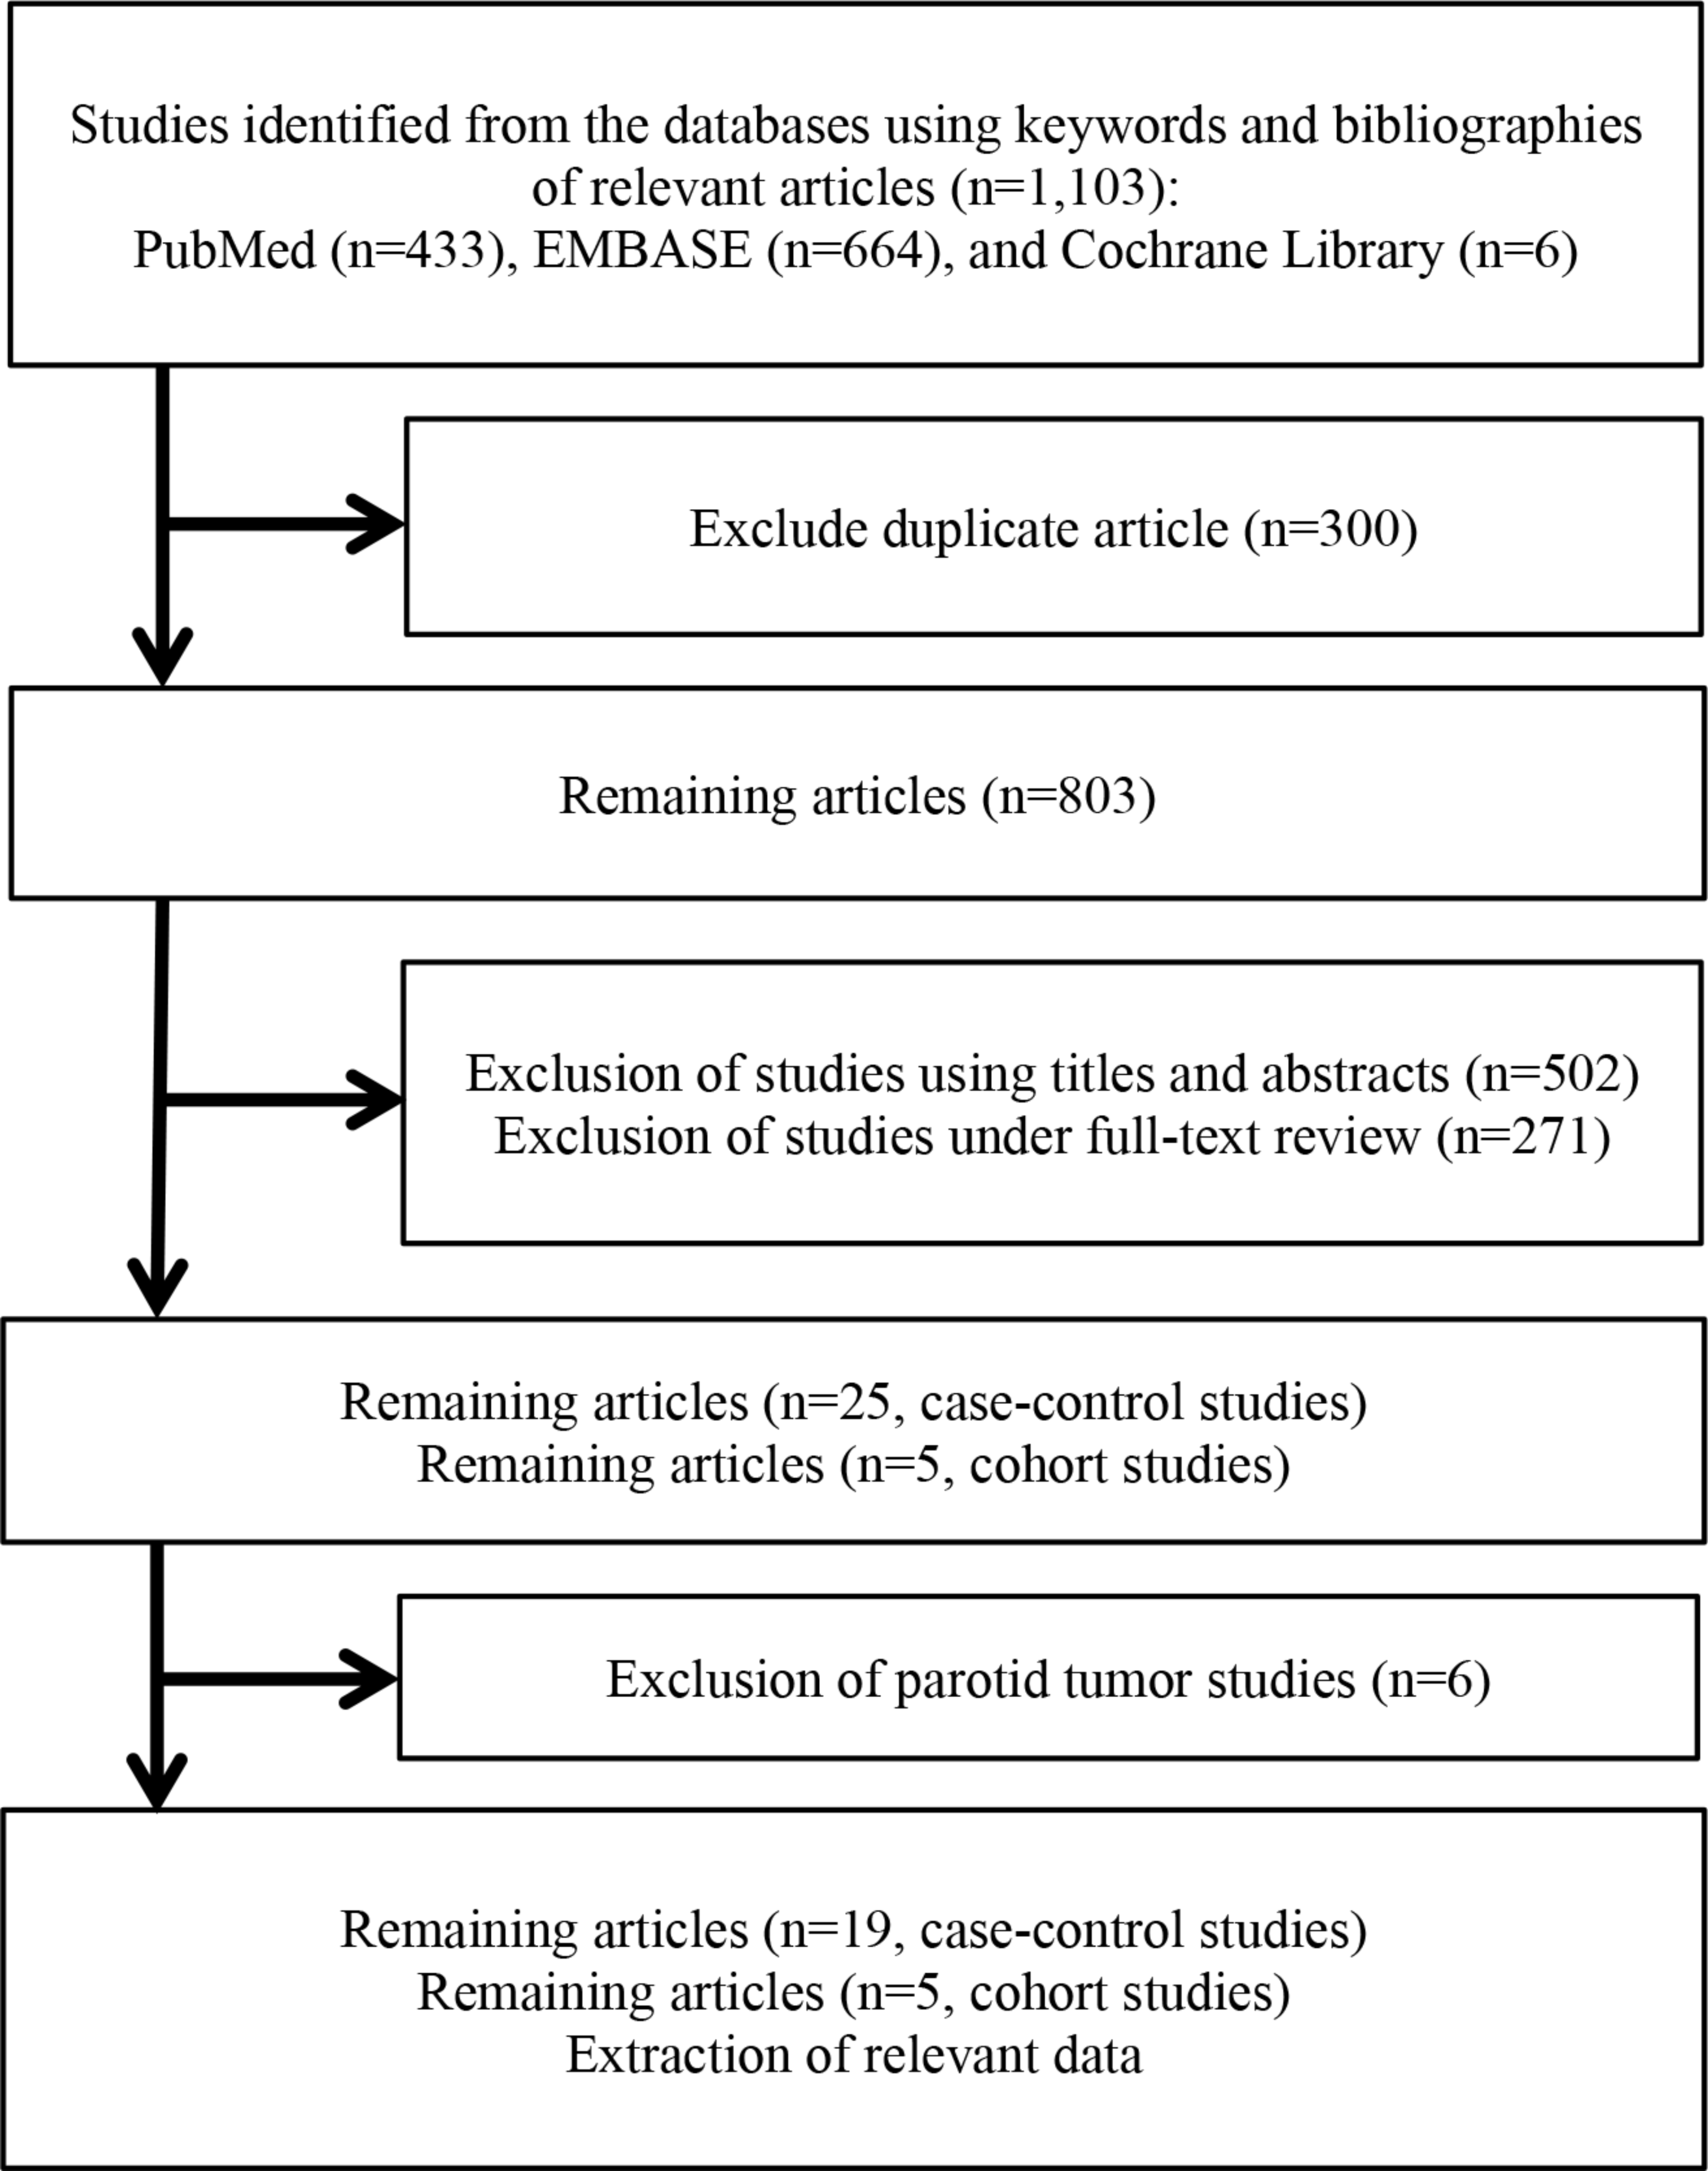
Figure 1 provides the screening and selection processes for this meta-analysis. A total of 1,103 articles were identified from three databases, including PubMed, EMBASE, and the Cochrane Library. After the exclusion of 300 duplicate articles, 803 articles remained. Through primary screening using titles and abstracts, 502 articles were excluded. And then, for the remaining 301 articles, a full-text review was conducted, with an additional 271 articles excluded. After that, only 25 case-control and 5 cohort studies articles remained. Among these articles, six case-control studies that dealt with benign or malignant parotid tumors were excluded (6 articles). Finally, 19 case-control studies and 5 cohort studies remained. Relevant data were extracted for these 19 case-control studies and 5 cohort studies.
Included and excluded case-control studies
Supplementary materials C-1 and C-2 provide the summary table for included studies and that for excluded studies due to duplicated data, respectively. The types of brain tumors included were glioma, meningioma, acoustic neuroma, pituitary tumors, malignant tumors, all brain tumors, and benign brain tumors. Duplicated data were marked as ‘Du’ and excluded from meta-analyses.
Selection and recall bias for the amount of cellphone use and misclassification and recall bias for ipsilateral/contralateral use
Supplementary materials D-1 and D-2 provide the authors’ bias rating regarding selection and recall bias for the amount of cellphone use and misclassification and recall bias for ipsilateral and contralateral use for case-control and cohort studies, respectively.
Examination for possible publication bias (case-control studies)
Supplementary material E provides the funnel plot and Egger’s regression test result. Egger’s p-value was 0.38.
Selection between a fixed-effect and a random-effect model
All meta-analyses conducted in this study showed a statistically significant Cochran’s Q test result. Therefore, a random-effect model was applied throughout all analyses of this study.
We applied a conventional meta-analysis model to this study and did not apply a multi-level meta-analysis model. This was because there was no interdependence between risk estimates from each study. Supplementary materials F-1 and F-2 provide a summary of study populations for case-control studies and cohort studies, respectively. Because studies with duplicated data were checked meticulously, marked as ‘Du’ in Supplementary C-2, and excluded from the final evidence synthesis, we could confirm that there was no interdependence among the risk estimate from each study, as the reader could check in Supplementary material F-1.
Meta-analyses and subgroup analyses for regular users, ipsilateral/contralateral uses, and years of use over/under 10 years (case-control studies)
Supplementary material G provides the list of included effect estimates for meta-analyses and subgroup analyses from each included study. The ORs for these three categories, regular users/non-regular users, ipsilateral/contralateral uses, and years of use over/under 10 years, were summarized in Supplementary material G-1, G-2, and G-3, respectively.
Table 1 summarizes the results of meta-analyses and subgroup analyses for regular users, ipsilateral/contralateral uses, and years of use over/under 10 years. Supplementary material H provides the forest plots for these meta-analyses and subgroup analyses. The pooled OR for regular users was 0.98 (95% CI 0.90–1.07). The pooled OR for ipsilateral uses and contralateral uses was 1.40 (95% CI 1.21–1.62) and 1.04 (95% CI 0.93–1.16), respectively. The pooled OR for years of use over and under 10 years was 1.27 (95% CI 1.08–1.48) and 0.96 (95% CI 0.88–1.04), respectively. The Q-statistic and p-value were 9.02 and 0.002, respectively, for the laterality of use category. The Q-statistic and p-value were 10.43 and 0.001, respectively, for the years of use category.
Meta-analyses and subgroup analyses stratified by tumor types (case-control studies)
The results of meta-analyses and subgroup analyses stratified by tumor types are provided in Table 2. For regular users, the pooled OR for meningioma was 0.86 (95% CI 0.77–0.95). For ipsilateral uses, the pooled OR for meningioma, glioma, and malignant tumors was 1.20 (95% CI 1.04–1.39), 1.45 (95% CI 1.16–1.82), and 1.93 (95% CI 1.55–2.39), respectively. For years of use over 10 years, the pooled OR for glioma was 1.32 (95% CI 1.01–1.71). All other pooled ORs were statistically equivocal.
Meta-analysis of total cumulative hours of use over 896 h (case-control studies)
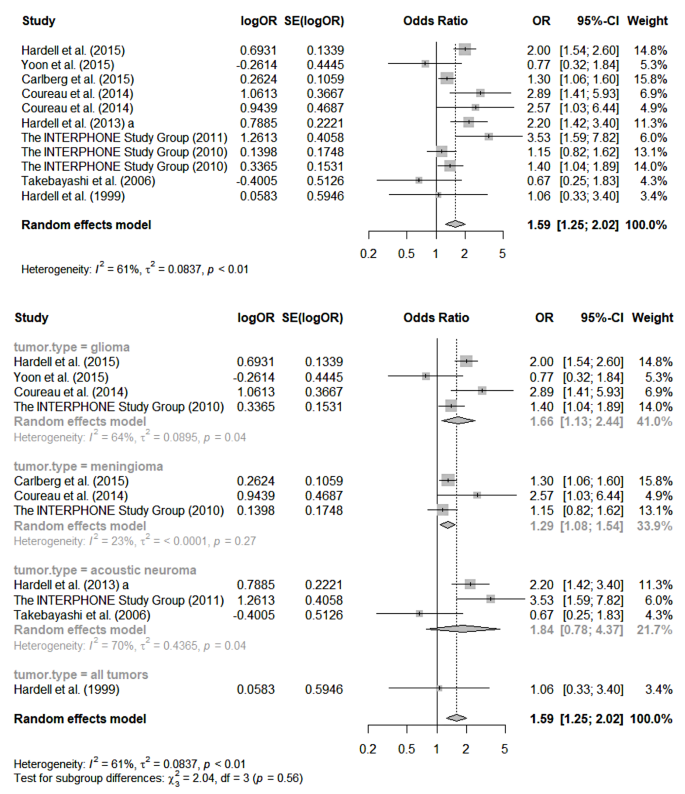
The characteristics of included studies for the meta-analysis of cumulative hours of use over 896 h are provided in Table 3. Of eleven effect estimates, seven were an increased OR with statistical significance. The remaining four effect estimates were statistically equivocal. Of these seven increased ORs with statistical significance, three were from glioma, the other two were from meningioma, and the remaining two were from acoustic neuroma. Figure 2 provides the forest plots for this meta-analysis. The pooled OR was 1.59 (95% CI 1.25–2.02). When stratified by each type of tumor, the pooled OR for glioma, meningioma, and acoustic neuroma was 1.66 (95% CI 1.13–2.44), 1.29 (95% CI 1.08–1.54), and 1.84 (95% CI 0.78–4.37), respectively.
Results of cumulative meta-analyses according to publication year and precision of each included study (case-control studies)
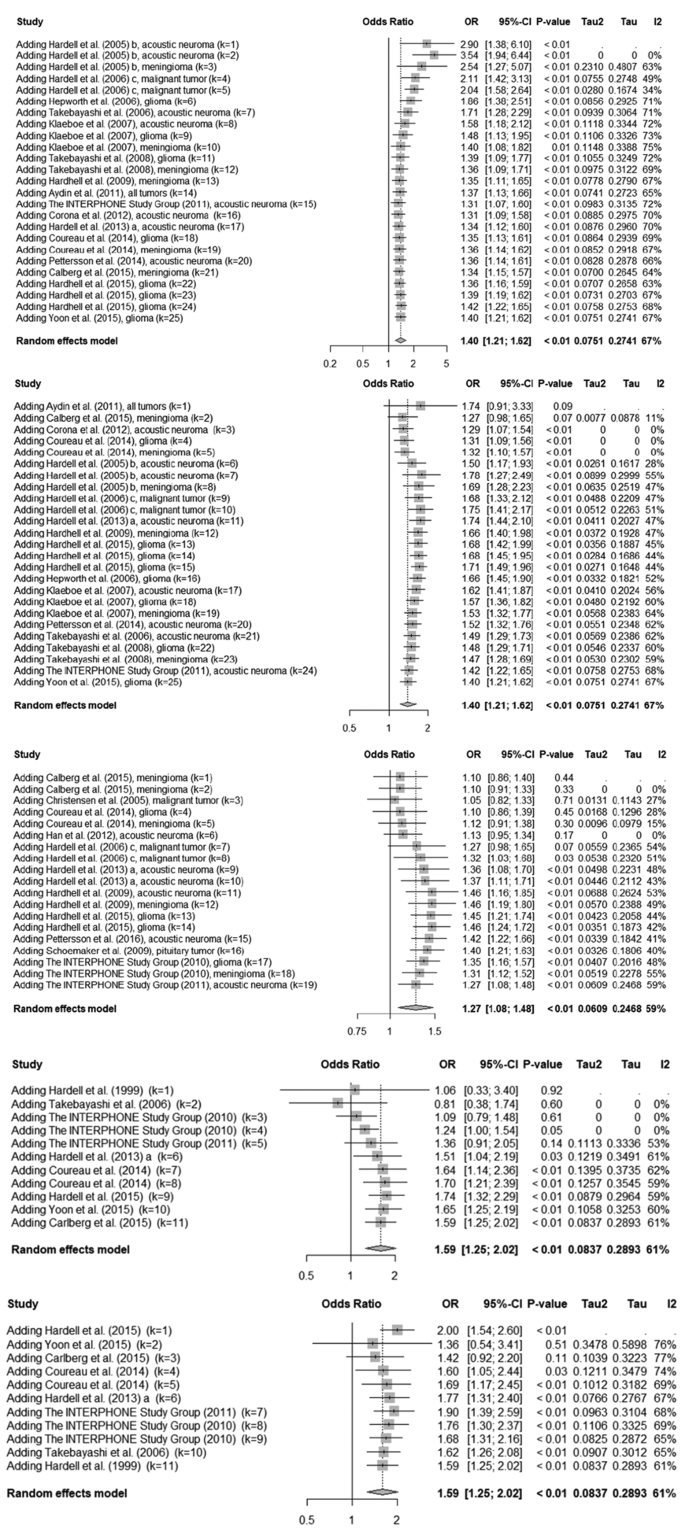
Figure 3 provides the results of cumulative meta-analyses according to the publication year, and the precision of each included study for ipsilateral users, years of use > 10 years, and total cumulative use > 896 h. The results of cumulative meta-analyses for regular users, contralateral users, and years of use < 10 years are provided in Supplementary material I.
For the cumulative meta-analysis according to publication year for ipsilateral users (Figs. 3 − 1), from 2005 to 2007 (k = 11), the pooled OR decreased from 2.90 (95% CI 1.38–6.10) to 1.40 (95% CI 1.08–1.82). After 2007 (k = 11), even though further studies were added, the point estimate of pooled OR did not change. However, the 95% CI was narrowed from (1.08–1.82) to (1.21–1.62). This phenomenon reflects that the reported individual OR was stabilized since 2007 after the formerly reported rather larger ORs for ipsilateral users.
For the cumulative meta-analysis according to precision for ipsilateral users (Figs. 3 − 2), until the 15th addition (k = 15), the pooled OR showed a rather stabilized estimate (1.71 (95% CI 1.49–1.96)). However, from then to the 25th addition (k = 25), the pooled OR decreased to 1.40 (95% 1.21–1.62). This indicates the studies with a lower precision had a lower OR estimate, and this could have biased the pooled OR downwards.
For the cumulative meta-analysis according to the precision for years of use > 10 years group (Fig. 3–3), the pooled OR increased from 1.10 (95% CI 0.86–1.40) to 1.46 (95% CI 1.16–1.85) until the 11th addition (k = 11). However, from then, the pooled OR decreased to 1.27 (95% CI 1.08–1.48) until the 19th addition (k = 19). This phenomenon indicates that the addition of the studies with a lower precision could have biased the pooled OR downwards.
For the cumulative meta-analysis according to publication year for the total cumulative hours of use > 896 h group (Figs. 3–4), after the stabilization of the pooled point OR in the 6th addition (k = 6) with 1.59 (95% CI 1.19–2.12), the pooled point OR did not change significantly until the 11th addition (k = 11). However, the 95% CIs were narrowed continuously from the 6th addition to the 12th addition, from (1.19–2.12) to (1.27–1.91). This phenomenon indicates that the included studies showed a moderate increased OR with statistical significance since 2013.
For the cumulative meta-analysis according to precision for the total cumulative hours of use > 896 h group (Figs. 3–5), the pooled OR increased until the 7th addition (k = 7) to 1.90 (95% CI 1.39–2.59). After that, the pooled OR decreased until the 11th addition (k = 11) to 1.59 (95% CI 1.25–2.02). This phenomenon indicates that the addition of the studies with a lower precision could have biased the pooled OR downwards.
Included cohort studies and evidence synthesis
Supplementary material J provides the characteristics of included cohort studies. The study period spread from 1982 to 2012. Two studies were conducted in Denmark [21, 22], and the other two studies were conducted in the UK [23, 24]. Another study was conducted in six countries, including Denmark, Finland, France, Sweden, the Netherlands, and the UK [25]. Supplementary material F-2 provides the summary of the study population for each cohort study. Based on this summary, we could confirm that there is no interdependence among the risk estimates from each study.
Supplementary material K provides the summary of risk ratios (RRs) reported in each cohort study. An increased RR with statistical significance (2.46 (95% CI 1.07–5.64)) was reported only once in Benson et al. (2013) for acoustic neuroma in the over 10 years of use vs. never-use category [23]. On the contrary, the RR for the ever-use vs. never-use category for glioma from Schuz et al. (2022) showed a decreased RR with statistical significance (0.89 (95% CI 0.80–0.99)) [24]. All other RRs were statistically equivocal.
Table 4 provides the summary of pooled RR for each tumor for ever-use vs. never-use and over 10 years of use vs. never-use categories, respectively. An increased point RR was reported only for acoustic neuroma in ever-use vs. never-use and over 10 years of use vs. never-use categories, respectively (1.26 (95% CI 0.98–1.61) and 1.61 (95% CI 0.91–2.85), respectively). However, the CI for these two RRs were statistically equivocal, including 1. The pooled RRs for all other categories were statistically equivocal. Supplementary material L provides the forest plots for each analysis.


