The most challenging of all scenarios for the central bank to tackle may be unfolding, as evidenced by the monumental gains in precious metals.
This has been a truly unique year for Wall Street. Following a short-lived crash in early April, the broad-based S&P 500 (SNPINDEX: ^GSPC), ageless Dow Jones Industrial Average (DJINDICES: ^DJI), and iconic Nasdaq Composite (NASDAQINDEX: ^IXIC) have all stormed back to reach record highs.
But at the same time as Wall Street’s major stock indexes are rallying, we’ve witnessed gold and silver surge to respective all-time highs. On Oct. 17, gold neared $4,360/ounce, while silver blew past its previous high by topping $53/ounce. While there have been periods throughout history where precious metals and the S&P 500 have positively correlated, this isn’t the norm.
Though an all-tides-are-green scenario has put smiles on the faces of precious metal and stock investors alike, year-to-date gains of 57% for gold and 65% for silver may signal that something sinister is in the offing for the U.S. economy and Wall Street. Consider it a possible worst-case scenario for Federal Reserve Chair Jerome Powell and his board of governors.
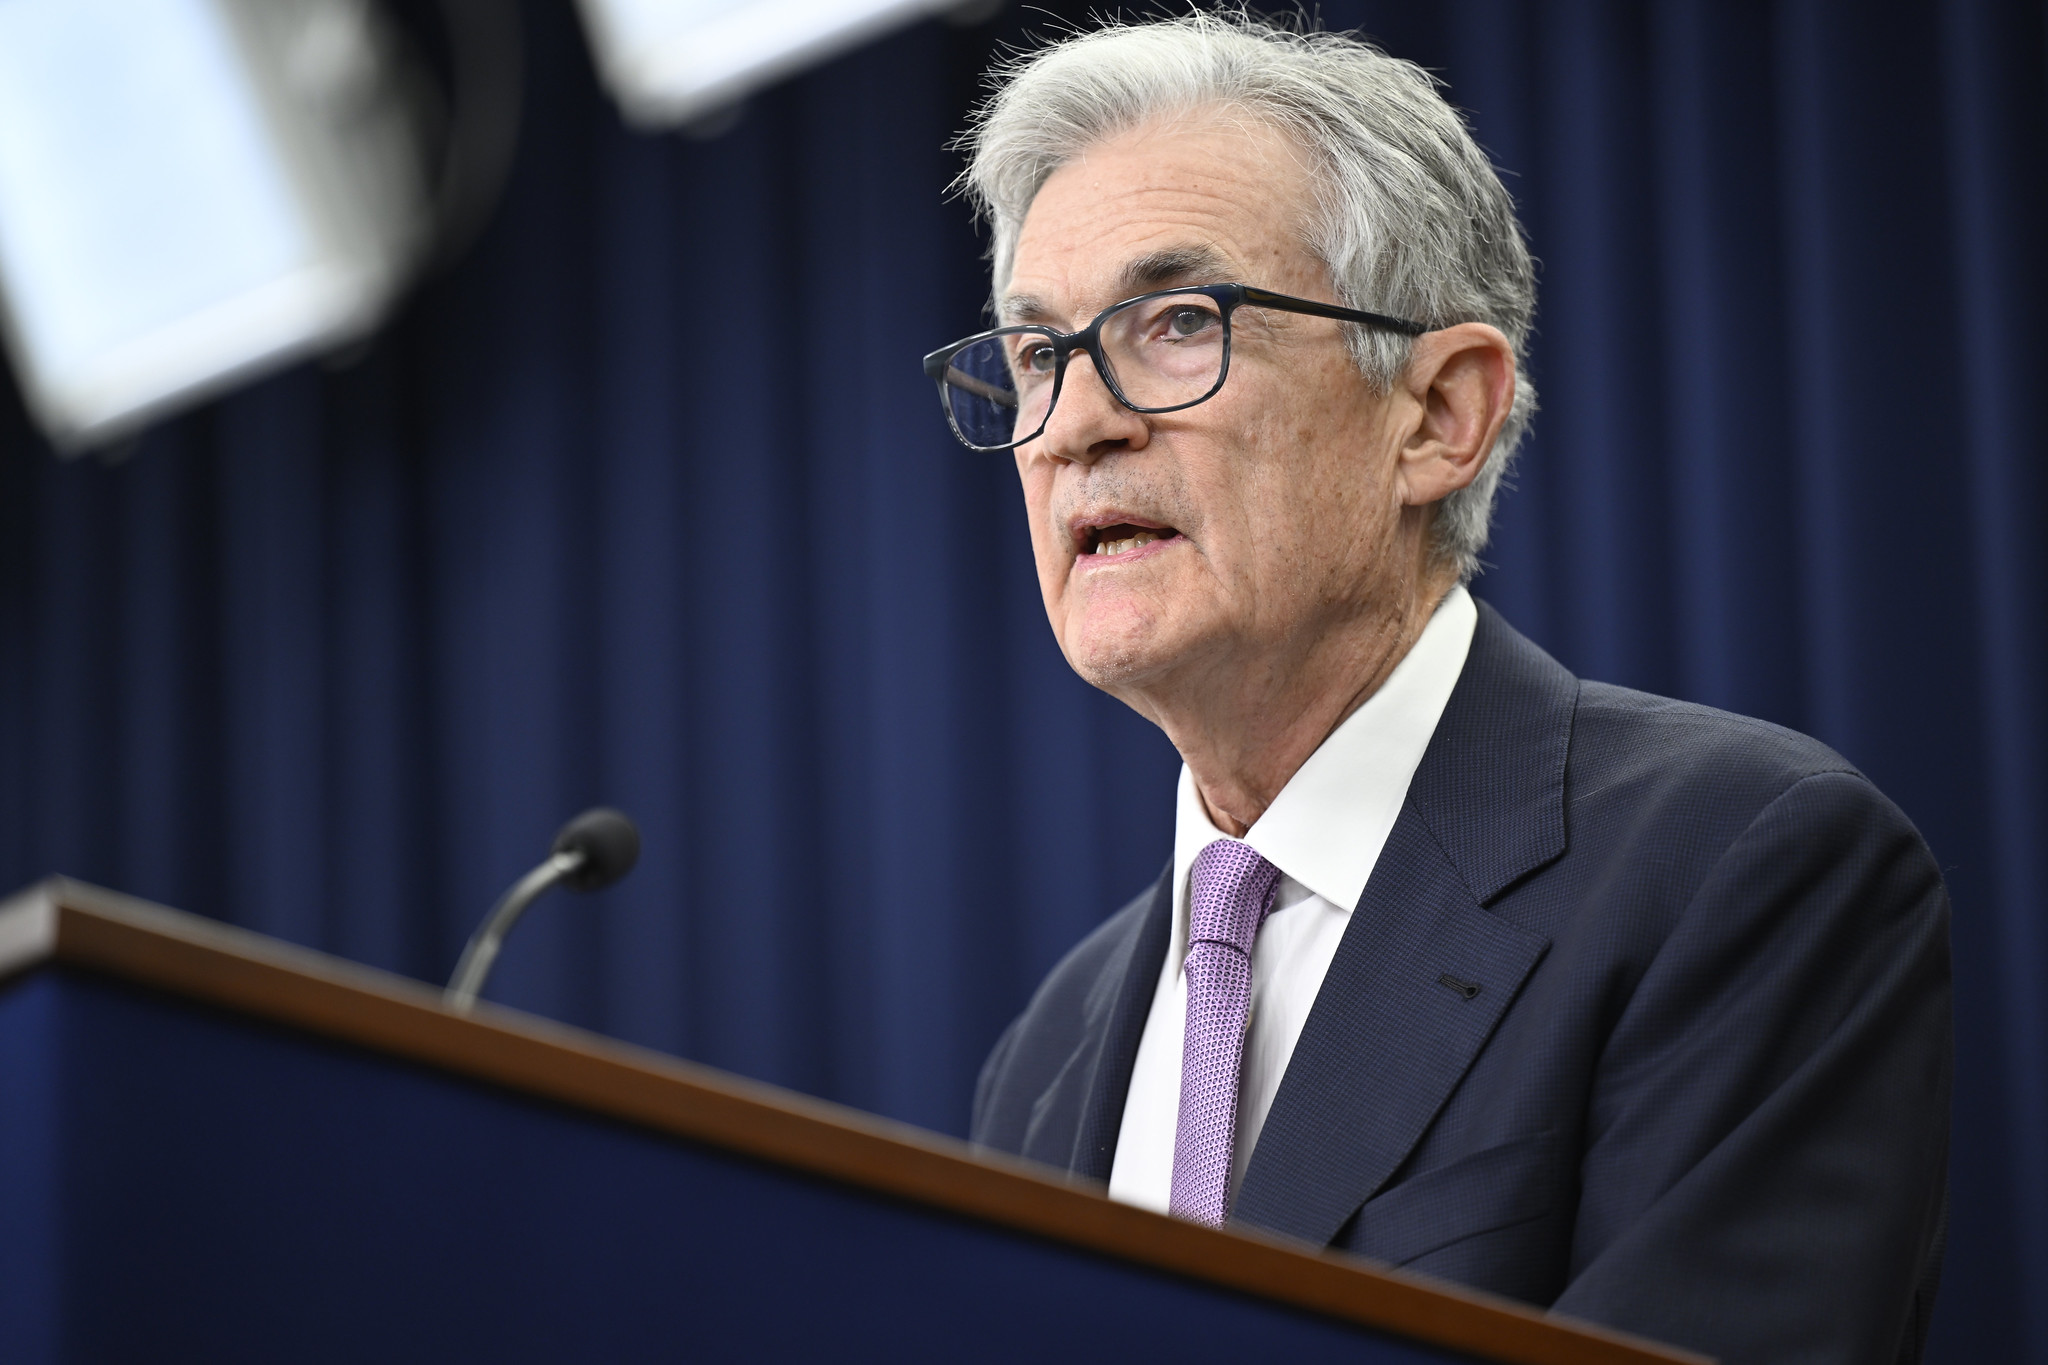
Fed Chair Jerome Powell fielding questions. Image source: Official Federal Reserve Photo.
All-time highs for gold and silver may portend the Fed’s worst nightmare
Let me preface the following discussion by making clear that nothing is set in stone. If commodities could predict the future with 100% accuracy, you can rest assured that every money manager would be doing the same thing (which they aren’t).
There are perfectly logical explanations for the jaw-dropping increases we’ve witnessed in precious metals this year. For example, there was a historic expansion of U.S. M2 money supply during the COVID-19 pandemic, which was partially fueled by fiscal stimulus. When money supply increases, it devalues existing dollars, which would be expected to drive up the value of physically finite resources like gold and silver.
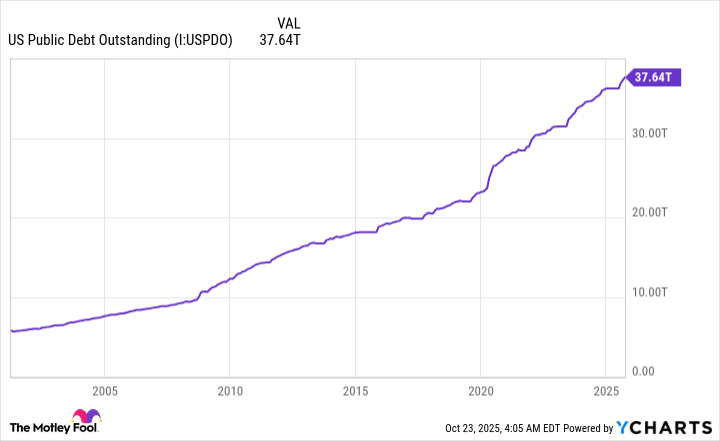
Additionally, rapidly rising national debt has a tendency to drive investors into precious metals. Federal government shutdowns, which have highlighted the inability of elected officials to come to a consensus on federal spending bills, have arguably provided a lift to gold and silver.
But the all-time highs gold and silver recently achieved may point to the prospect of something more nefarious: stagflation.
Stagflation is characterized by a period of rising inflation, a higher/rising unemployment rate, and weaker or stagnant economic growth — and it’s probably the Fed’s worst nightmare.
Jerome Powell and the central bank influence the U.S. economy through monetary policy and open-market operations. This includes raising or lowering the federal funds rate, which impacts interest rates and can indirectly affect mortgage rates, as well as buying or selling U.S. Treasury bonds, which increase or reduce long-term yields (bond prices and yields have an inverse relationship).
If the Fed chooses to lower interest rates during a period of stagflation to spur lending, hiring, and economic growth, it can further ignite an already hot inflation rate. On the other hand, raising interest rates when stagflation is present can further hamper economic growth and weaken the job market.
There’s no blueprint for tackling stagflation — and precious metal investors know it! Gold and silver are often viewed as a hedge against inflation and uncertainty, which are the hallmarks of stagflation.
Image source: Getty Images.
Hints of stagflation have begun to crop up
According to Fed Chair Powell, stagflation isn’t something that keeps the board of governors up at night: “We have warned of it, but it is not something that we are facing or that we expect to face.”
Nevertheless, some of the puzzle pieces necessary for stagflation to take shape have been falling into place.
First, the prevailing rate of inflation appears to be performing an about-face after plunging from a trailing-12-month (TTM) peak of 9.1% in 2022. Between May and August, the TTM inflation rate for the encompassing Consumer Price Index (CPI) for All Urban Consumers has jumped from 2.35% to 2.92%.
While this 57-basis-point jump might not sound like much, it’s being fueled by President Donald Trump’s tariff and trade policy. Duties applied to imported goods used to finish the manufacture of products in the U.S. (known as “input tariffs”) can increase prices for consumers and businesses domestically.
Furthermore, we’re seeing evidence that inflation is broadening to more categories. The post below on social media platform X (formerly Twitter) from Mike Konczal, the former Chief Economist of the National Economic Council under former President Joe Biden, shows that 59% of 142 CPI items were climbing by at least 3% on a TTM basis, as of the end of August. This suggests the prevailing rate of inflation will continue to climb.
Meanwhile inflation is broadening. Here’s percent of items that had at least a 3 percent (annualized) price increase over the last month, something Waller used to flag the 2023 disinflation.
I brushed this off and am surprised at its increase. ~60% for both core and overall. /3 pic.twitter.com/oSqE3iCDal
— Mike Konczal (@mtkonczal) September 11, 2025
At the same time, the labor market has been challenging.
From May through July, preliminary estimates showed 139,000, 147,000, and 73,000 nonfarm jobs were created, respectively. But in the following months, these figures were revised to a gain of just 19,000 jobs in May, a loss of 13,000 jobs in June (the first monthly job loss since December 2020), and 79,000 jobs created in July. Even with the modest upward revision in July from the initial estimate, the revisions in May and June collectively account for 280,000 fewer nonfarm jobs created than initially reported.
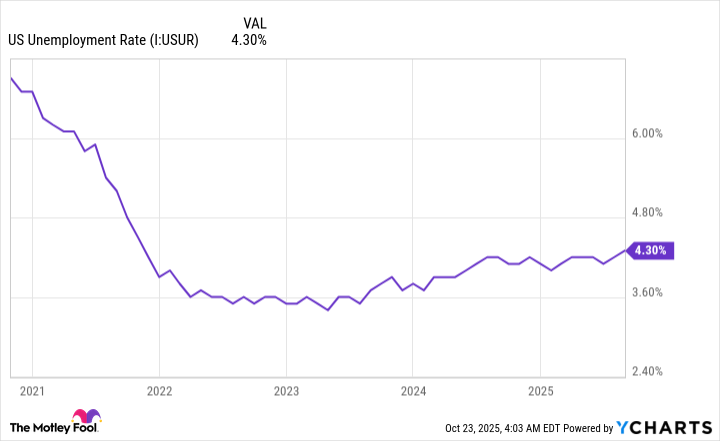
While the U.S. unemployment rate of 4.3% remains historically low, it’s the highest level in nearly four years.
The last puzzle piece is economic growth. The final reading for U.S. gross domestic product (GDP) growth for the second quarter clocked in at 3.8%, which reversed a 0.6% contraction in U.S. GDP during the first quarter. While economic growth doesn’t appear stagnant or slowing, based on what occurred in the second quarter, the surge we’ve witnessed in gold and silver suggests the U.S. economy isn’t out of the woods.
This is the U.S. economy’s and Wall Street’s silver lining
While the rapid rise in gold and silver points to potential trouble for the U.S. economy and stocks, there’s also a silver lining for the economy and Wall Street that shouldn’t be ignored by investors.
Truth be told, we can’t predict the future with concrete accuracy. At some point, the U.S. economy is going to weaken and fall into a recession, which history tells us is perfectly normal, healthy, and inevitable. But there’s a very clear nonlinearity to these boom-and-bust cycles that favors optimists and investors who think long-term.
Since World War II ended 80 years ago, the U.S. economy has endured a dozen recessions. The average length of these downturns is a mere 10 months, with none lasting longer than the Great Recession, which stuck around for just 18 months.
On the other end of the spectrum, the typical economic expansion has persisted for about five years, with two periods of growth surpassing the 10-year mark. Even though challenges are perfectly normal for the U.S. economy, the Fed has historically done a phenomenal job of steering the ship. History shows that the U.S. economy expands over long periods.
The disproportionate nature of economic cycles translates to Wall Street.
It’s official. A new bull market is confirmed.
The S&P 500 is now up 20% from its 10/12/22 closing low. The prior bear market saw the index fall 25.4% over 282 days.
Read more at https://t.co/H4p1RcpfIn. pic.twitter.com/tnRz1wdonp
— Bespoke (@bespokeinvest) June 8, 2023
Shortly after the S&P 500 was confirmed to be in a new bull market in June 2023, the researchers at Bespoke Investment Group published a data set to X that compared the calendar-day length of every S&P 500 bull and bear market dating back to September 1929 (the start of the Great Depression).
Bespoke’s data showed the average bear market lasted only 286 calendar days, or approximately 9.5 months. In comparison, S&P 500 bull markets stuck around for an average of 1,011 calendar days, or roughly 3.5 times as long.
Even when economic indicators are sending all the wrong signals, history serves as a stark reminder that the U.S. economy and stock market tend to grow over extended periods.
